

Trump's Base and the 2026 Midterms
Will growing discontent among Trump voters hurt Republicans in the upcoming elections?
Dear Readers,
Today’s post explores presidential approval and congressional preferences among the president’s base voters. The newsletter digs deeper into data I explored in our June post that provided a framework for thinking about the upcoming midterm election. I’m also writing to let you know that the next Franklin & Marshall College Poll will be released on August 27, 2026. The August poll results will provide updated information about the trends to watch when considering the midterms.
Thank you for reading,
Berwood Yost
Presidential Approval, Congressional Preferences, and Trump’s Base
As President Trump’s approval ratings continue to sink, questions about whether his base is eroding and how that erosion is going to hurt Republicans in the midterms are becoming commonplace. The true heart of Trump’s base is white working-class voters, typically documented in surveys as those white voters who do not have a college degree. The foundational importance of Trump’s working-class supporters (Yost et al 2017) and their emotional connections to the president (Koenig 2022) have been an essential element of our elections for the past decade.
About half of Pennsylvania’s electorate in 2024 (49%) and 2020 (53%) were white voters with no college education. These voters overwhelmingly supported Trump in both elections. Among white men with no college degree Trump’s margins were 64 – 35 over Biden and 68 – 31 over Harris, and among white women with no college degree his margins were 59 – 41 and 57 – 42 in those same elections.
The president’s job approval ratings among white working-class voters in the state have been positive throughout his time in office (see Figure 1). His job approval ratings were notably high as he approached his first re-election campaign in 2020 and reflected how much support he had from that group of voters in that campaign. Trump’s approval ratings from this group were relatively high at the start of his second term, but they have started to fade among this group of voters, as they have among other voting groups. In June their positive job approval ratings were about ten points higher Figure 1 compares Trump’s positive job approval ratings in Pennsylvania for college and non-college white voters at several points in time. The decline in President Trump’s approval ratings among both groups of voters seems to follow a similar trajectory.
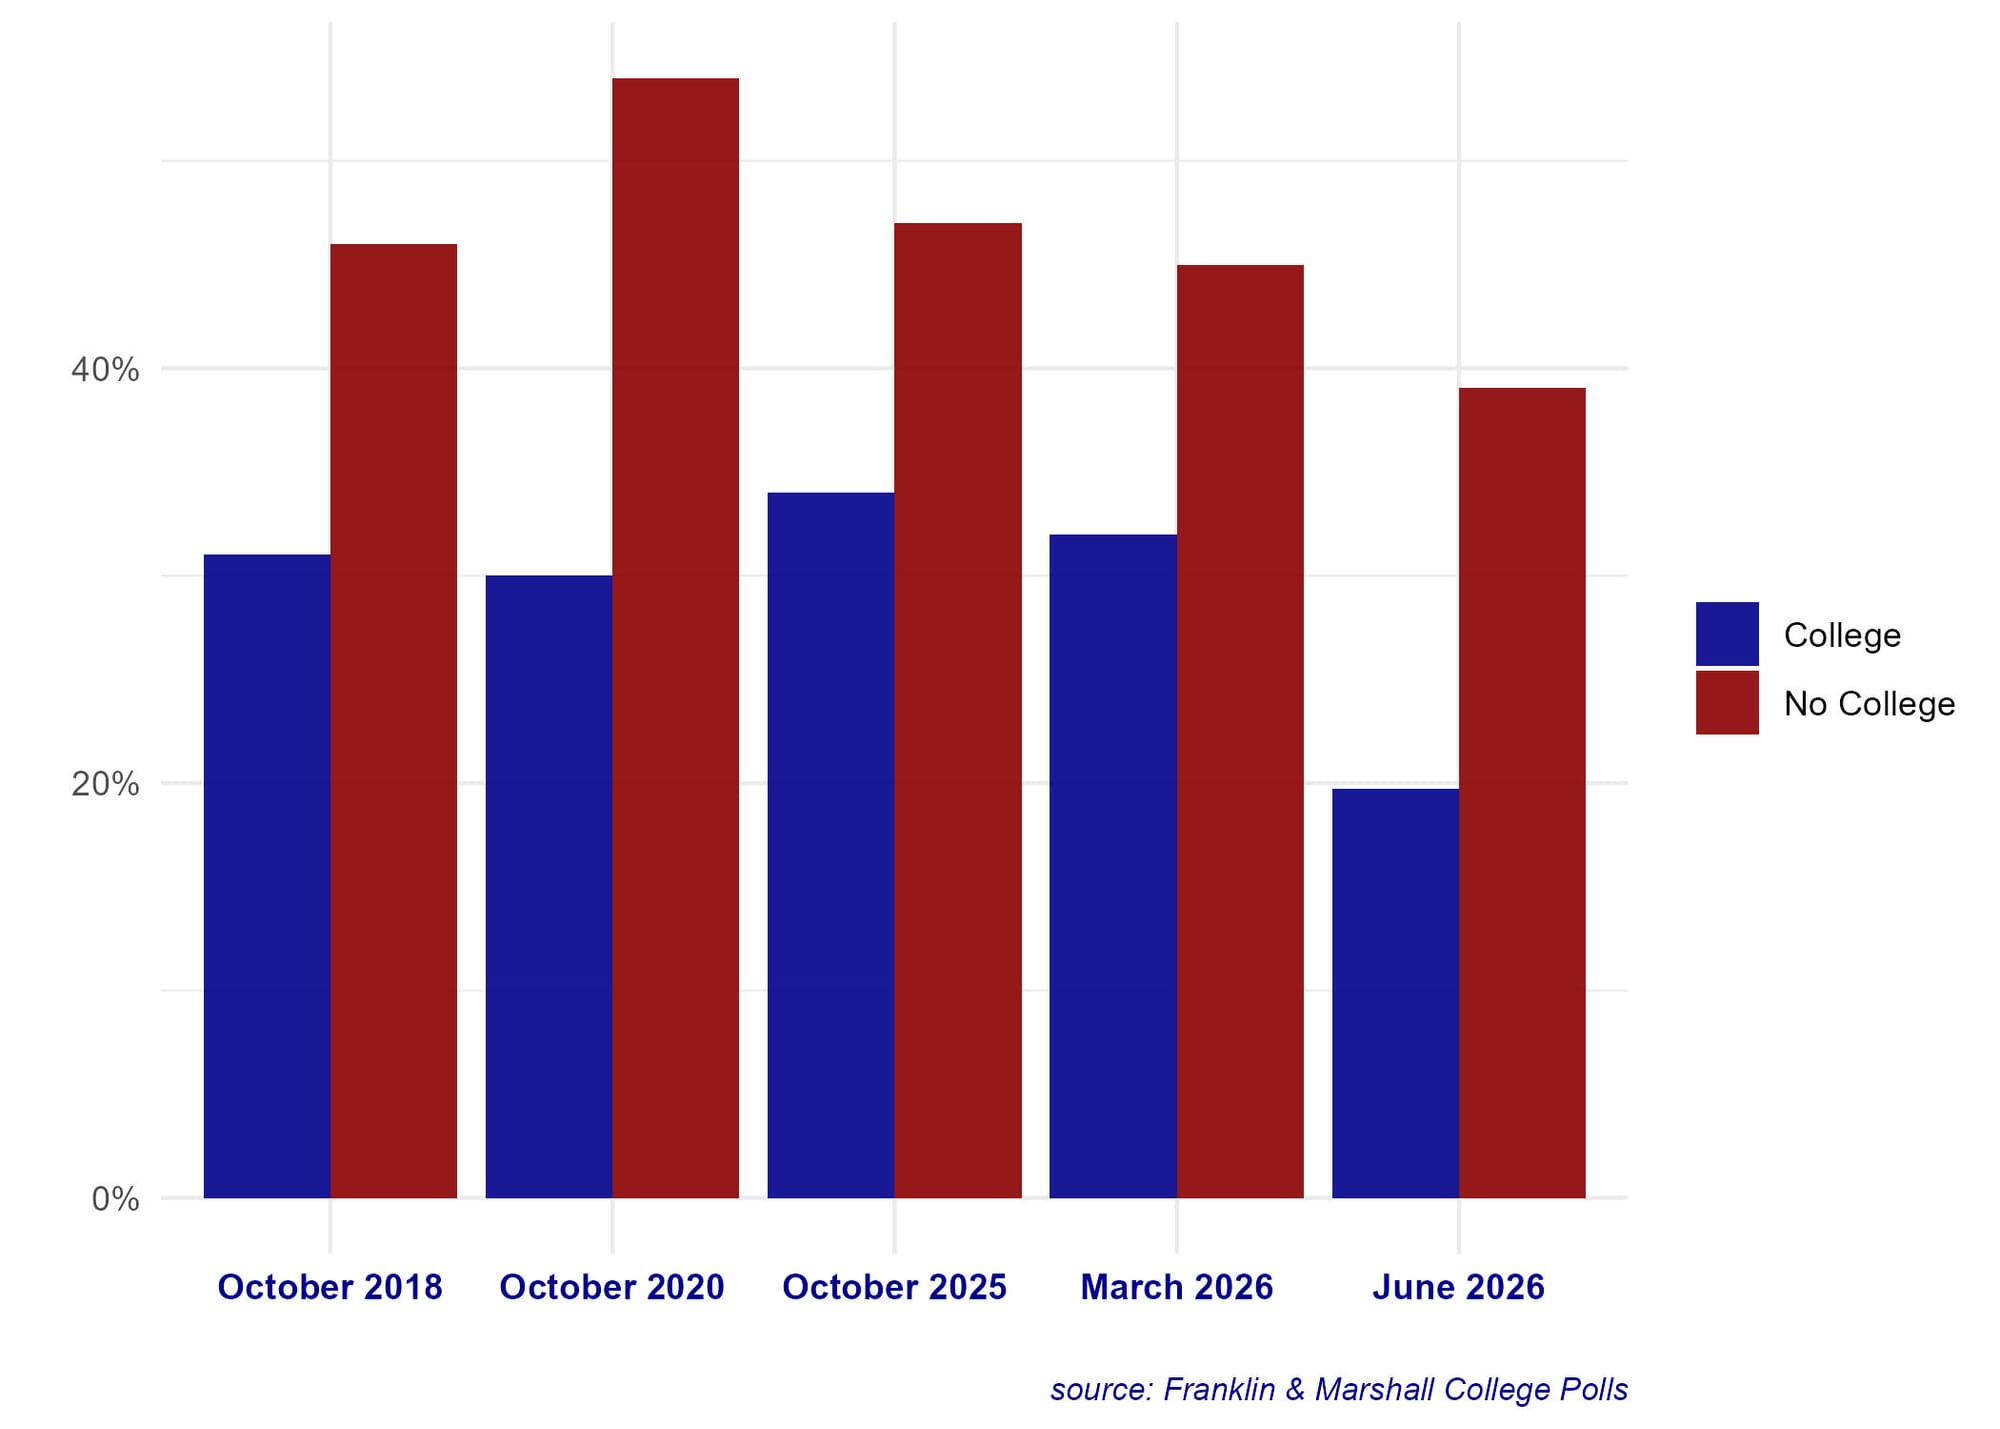
Despite the decline in the president’s approval ratings, these voters are still more supportive of Republican than Democratic congressional candidates. Last October, white working-class voters preferred Republicans to Democrats by eight points and that remained basically unchanged in June at nine points. At least so far, these voters’ preference for Republican congressional candidates hasn’t changed, which is really important for down-ballot races this year.
The consensus of most election handicappers is that three of the state’s congressional districts (PA-7, PA-8, and PA-10) are toss-up races. About two-thirds of the residents in each of these districts are non-Hispanic white, and the share of college-educated voters in each is below the state average. Census data suggests that white, non-Hispanic, non-college educated voters represent roughly 42% of age-eligible voters in PA-7 and PA-10 and about 51% of age-eligible voters in PA-8[i]. Republicans in these toss-up districts can be helped by a strong showing from the president’s base voters, and the fact that their preferences remain strongly supportive of Republican congressional candidates is important to recognize.
But is Trump’s Base Enthusiastic About Voting?
The other part of the story is whether white working class voters will come out on election day when the president is not on the ballot. This is where Republican candidates are facing a sizable problem—as of June, whites with a college degree were about ten points more likely to say they were planning to vote in November than whites without a college degree (59% likely compared to 49% likely).
The turnout gap between college and non-college whites in Pennsylvania played a role in the outcomes of the past two midterms. In 2018, Democratic congressional candidates won 55% of the state congressional vote due in part to the sizable turnout gap, but in 2022 that gap was smaller and Democrats won only about 47% of the state congressional vote.
The outcomes of the most competitive races in November will turn on the behaviors of white working-class voters. Their interest and motivation to vote is a storyline worth following as election day approaches.
[i] The Census Bureau’s ACS 2024 1-Year Estimates report that non-Hispanic Whites make up 72% of Pennsylvania adults and that about 36% of adults in Pennsylvania have a college degree. The estimates of White, non-Hispanic, non-college educated voters are based on estimates from ACS Tables B15002A and S0201.
Franklin & Marshall College Poll Newsletter
Join the newsletter to receive the latest updates in your inbox.