

Franklin & Marshall College Poll Release: PA 7th and 10th Congressional Districts, September 2026
The attitudes of the state's voters in these districts show patterns similar to state and national data. Democrats are favored in the congressional races, economic issues are a top concern, and President Trump's performance is rated negatively.
Dear Readers,
I’m writing to share our summary report for the September 2026 Franklin & Marshall College Congressional District Poll. I’ve highlighted a few of the key findings below, but I encourage you to read the full report, which is attached. The poll explores the mood of Pennsylvania voters in the state’s 7th and 10th Congressional Districts. The full report includes cross-tab tables as attachments for the congressional races in each district as well as a detailed statement about how we conducted the poll.
Thank you for reading,
Berwood Yost
Key Findings
The attitudes and preferences of registered voters living in Pennsylvania’s 7th and 10th Congressional Districts show patterns that are similar to state and national data that favor the Democratic candidates in congressional races. At the same time, the findings from our September poll reveal district-level differences that demonstrate how national patterns are filtered through local electoral dynamics.
Similarities and Differences in Selected Electoral Indicators
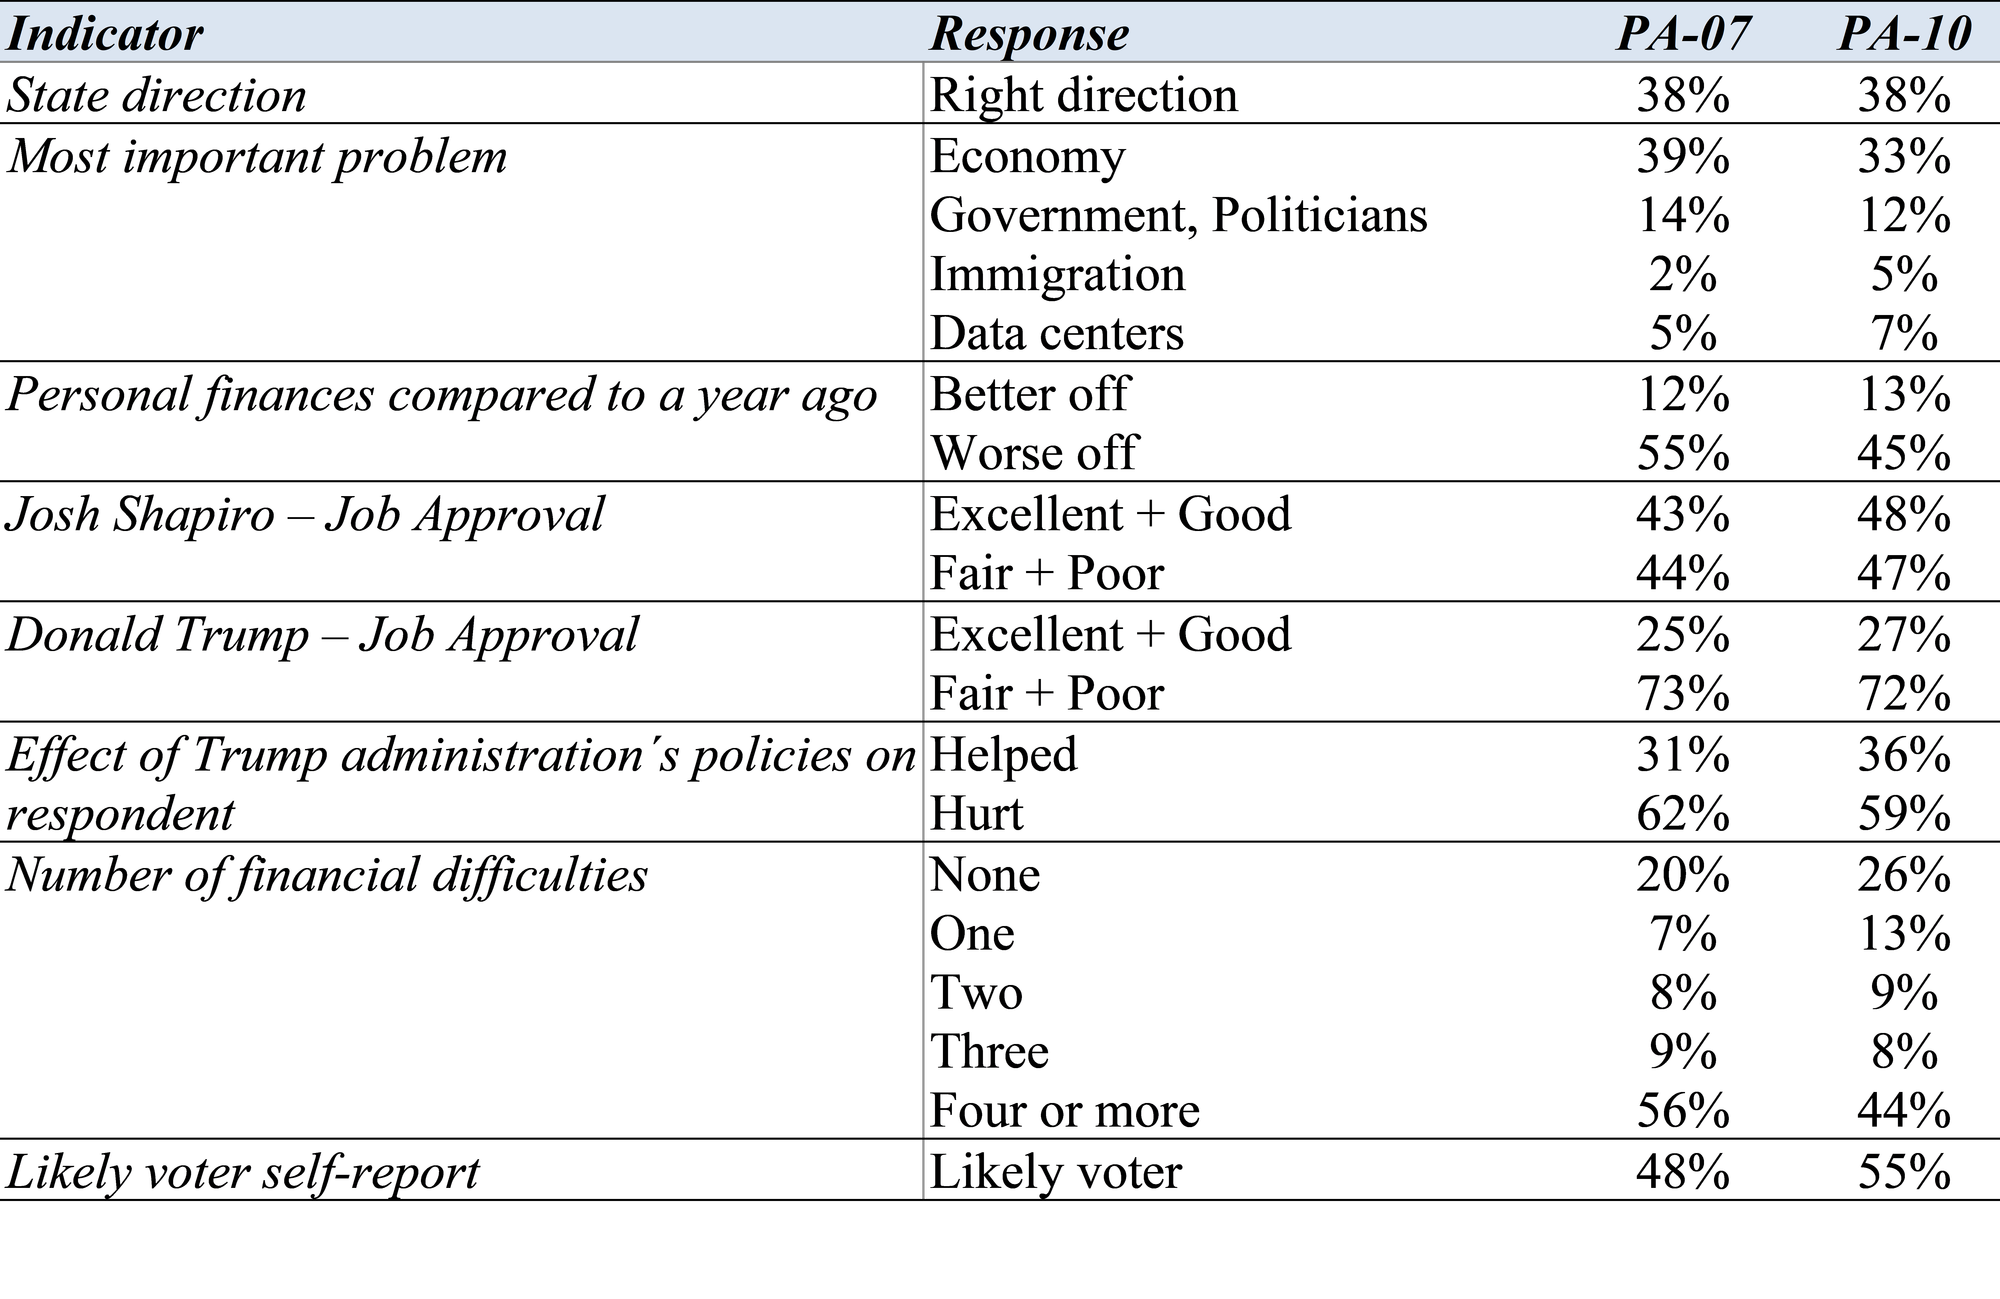
Table 1 compares registered voters’ responses to eight election indicators for PA-7 and PA-10 that will shape the electoral outcomes in these races. Registered voters in PA-7 are more concerned about economic issues, they feel worse about their personal finances, and they are experiencing more financial difficulties than are voters in PA-10. When asked which party they think can do a better job of dealing with their economic concerns, the registered voters in PA-7 give Democrats a smaller advantage on handling the economy (+ 14 points) than do voters in PA-10 (+ 24 points). Statewide, Democrats had an advantage of + 24 among voters concerned about the economy in the August Franklin & Marshall College Poll. Voters in PA-7 also give Governor Shapiro slightly lower job approval ratings than voters in PA-10, which are about the same as his statewide approval ratings.
Voters in both districts provide similar, negative ratings of the president’s performance. Only about one in four registered voters in both districts rate President Trump’s job performance as “excellent” or “good” and about twice as many voters in each district believe his policies have hurt them more than they have helped them. These district-level ratings are similar to the ratings the state’s voters provided President Trump in August.
Finally, differences in the partisan, ideological, religious, and racial composition of these two districts are important to acknowledge (see the topline summary for details). PA-7 is more racially and ethnically diverse with a larger Hispanic population than PA-10, and it also has a larger share of moderate voters. PA-10 is more strongly partisan and Republican leaning than is PA-7, and it also has more people who identify with mainline religious groups. These demographic and political differences influence the topline feelings about the current electoral environment and about who voters in those districts are likely to prefer for US Congress in November.
Table 1. Selected Electoral Indicators for PA-7 and PA-10, September 2026
Congressional Races and Correspondence with the General US Mood
The President’s low job approval ratings and voters’ concerns about the economy are creating significant headwinds for Republican candidates. For instance, about two in five (43%) Republicans in PA-7 and one in three (33%) Republicans in PA-10 report they are “worse off” financially than they were a year ago. The Republican congressional candidates in both districts only win about 7 in 10 Republican voters who report being “worse off,” while they win almost every Republican who says they are “better off.” More Democrats than Republicans in both districts (PA-7 D +8, PA-10 D +15) say they are “very interested” in the upcoming election.
Democrat Bob Brooks currently leads Republican Ryan Mackenzie in PA-7, 45% to 40%, while Democrat Janelle Stelson leads Republican Scott Perry 47% to 44% in PA-10. Both Democrats lead their Republican challengers among independent and moderate voters. There are twice as many “undecided” voters in PA-7 (16%) as in PA-10 (9%) at the moment. The lead for both Democrats is larger among likely voters, but those numbers are not reported because of the small sample size of the likely voter pool.
President Trump won both of these congressional districts in 2024, with a slightly larger advantage in PA-10 (5.2 points) than in PA-7 (3.2 points). The margins in both districts at the moment indicate a Democratic swing of about 8 points from 2024, which is in line with current expectations given the national mood. One component of this swing is evident in the choices that President Trump’s base, white working-class voters, are making in these races. These voters overwhelmingly supported President Trump in 2020 and 2024, but recent surveys have shown that the President’s support among white working-class voters has been slipping. Consequentially, the Republican candidates in both of these districts are currently underperforming among these voters. These races likely hinge on whether that under performance continues.
Methodology
The survey findings presented in this release are based on the results of interviews conducted September 9 - 20, 2026. The interviews were conducted at the Center for Opinion Research at Franklin & Marshall College. The data included in this release represent the responses of registered voters who live in Pennsylvania congressional districts seven and ten. In PA-7, there were 147 Democrats, 136 Republicans, and 74 independents and in PA-10, there were 145 Democrats, 167 Republicans, and 78 independents.[1] The sample of voters was obtained from Aristotle. All sampled respondents were notified by mail about the survey. Interviews were completed over the phone and online depending on each respondent’s preference. Survey results were weighted (age, gender, education, geography, vote history, and party registration) using an iterative weighting algorithm to reflect the known distribution of those characteristics.
The sample error for the survey of registered voters in PA-7 is +/- 5.8 percentage points and in PA-10 it is +/- 5.7 percentage points when the design effects from weighting are considered. The sample error for questions based on subgroups is larger. In addition to sampling error, this poll is also subject to other sources of non-sampling error. Generally speaking, two sources of error concern researchers most. Non-response bias is created when selected participants either choose not to participate in the survey or are unavailable for interviewing. Response errors are the product of the question and answer process. Surveys that rely on self-reported behaviors and attitudes are susceptible to biases related to the way respondents process and respond to survey questions.
Note: This poll was supported by a gift from F&M Alumnus Brett Harwood, Class of ’71.
[1] The data reported here is voter REGISTRATION and is consistent with past reporting practices. The survey also asked about self-reported voter IDENTIFICATION which can produce slightly different partisan splits and is reported in the topline summary. Partisan comparisons in this summary show self-reported registration.
Franklin & Marshall College Poll Newsletter
Join the newsletter to receive the latest updates in your inbox.