
Framing the 2026 Midterms
Our June newsletter takes a close look at the trends to watch when thinking about the upcoming midterm elections.
Dear Readers,
Today’s newsletter provides you with a framework for thinking about the indicators that are most likely to dictate the outcomes of the upcoming midterm election. I hope you find it interesting and useful. I’m also writing to let you know that the next Franklin & Marshall College Poll will be released on June 18, 2026. The June poll results will further show the trends to watch when thinking about the midterms.
Thank you for reading,
Berwood Yost
Three Data Bundles to Consider
It’s time to start thinking about the November midterm races now that the state’s primary elections are complete. This article provides a simple data framework to help think about what is likely to motivate voters in November. Political control of state government and two of the three elected bodies of the federal government are in play, so this election cycle will determine the direction of state and federal policy for the next few years.
There are three bundles of data we look at to understand the direction of public opinion and what that means for each party’s chances of electoral success. Those three bundles include assessments of the general mood, presidential approval and congressional preference ratings, and determining the issues voters care most about, including whether the party in power is addressing those issues.
The Policy Mood
The policy mood is the relative left-right position voters take on policies related to the proper size and scope of the federal government.[i] The policy mood represents how voters are feeling about the effects of the general direction policy has taken under the administration in power on partisan issues like taxes, healthcare reform, defense, poverty alleviation, immigration, and the economy.
More registered voters believe the state is “on the wrong track” (44%) than believe it is “headed in the right direction” (39%), according to our March poll. The last time a majority of registered voters believed the state was headed in the right direction was January 2020.
Even more important than knowing how voters feel about the overall direction of the state and nation is knowing how they feel about their personal finances. Nearly two in five (36%) respondents in our last survey said say they were “worse off” financially than a year ago and only 20% said they were “better off.” October 2020 was the last time more voters said they were better off than worse off financially. Voters are not happy right now and in fact they haven’t really been all that happy since before the pandemic.
One consequence of these general mood shifts is that the way people identify politically can also shift. For the first time since 2021, more voters identify as Democrats (45%) than Republicans (42%) in Pennsylvania. This movement also appears in the state’s voter registration data—for the first time since 2018, more people switched their party registration to the Democrats than to the Republicans.
Patterns in national data since the March F&M Poll make it likely that the general mood is even more pessimistic and negative than described here. There is little doubt that the general mood is running against Republicans at the moment.
Presidential Approval and Congressional Preferences
The general policy mood also relates to how voters judge the performance of elected officials, mostly the president. Political scientists think that the public normally reacts to the president’s policies because citizens’ preferences are shaped at least in part by what the government is doing. That is, preferences are not absolute and fixed for most people, but relative and responsive to what they see happening. You may have heard these predictable reactions referred to as the “thermostatic” policy response.
The policy mood tends to move in a direction that is opposite to the party that controls the White House. This movement is systematic: only two times since World War II has the president’s party gained US House seats in a midterm. In March, Democrats led the generic congressional vote in Pennsylvania, 44% to 37%, so that normal process seems to be underway this year.[ii]
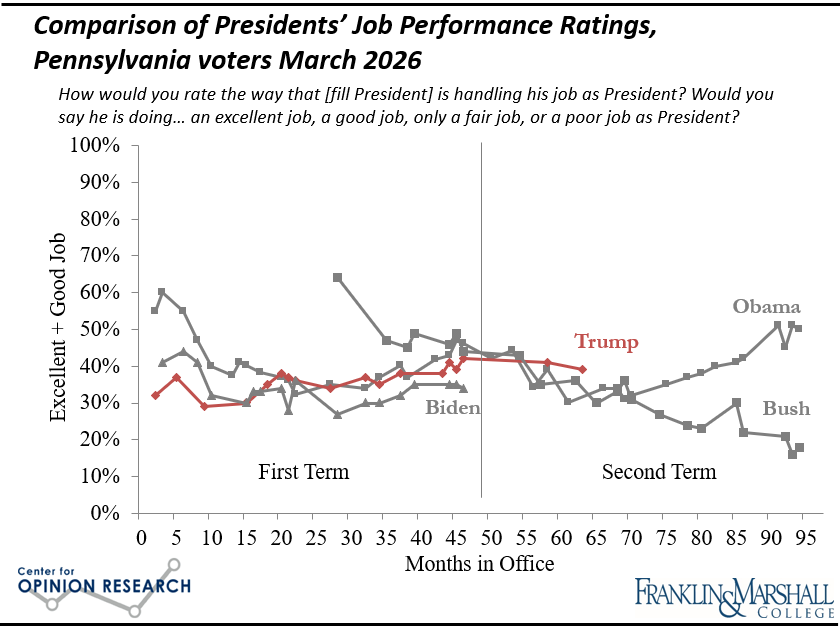
Though it seems almost inevitable that the president’s party is going to lose seats, it is also true that a president’s performance can make the electoral dynamics even more difficult for his party. Generally speaking, the lower a president’s job approval below a certain point, the more seats his party tends to shed during the midterms.[iii] President Trump’s job approval ratings in Pennsylvania were 39% in March (Figure 1) and national polls show he has lost ground since. The president’s low approval ratings create headwinds for Republican candidates this year.
Issues and Issue Ownership
The general mood, congressional preferences, and presidential approval indicators would be stronger for Republicans if citizens believed that the president and his party were addressing the issues they most care about or passing policies that they support. But the issue indicators are also running against Republicans.
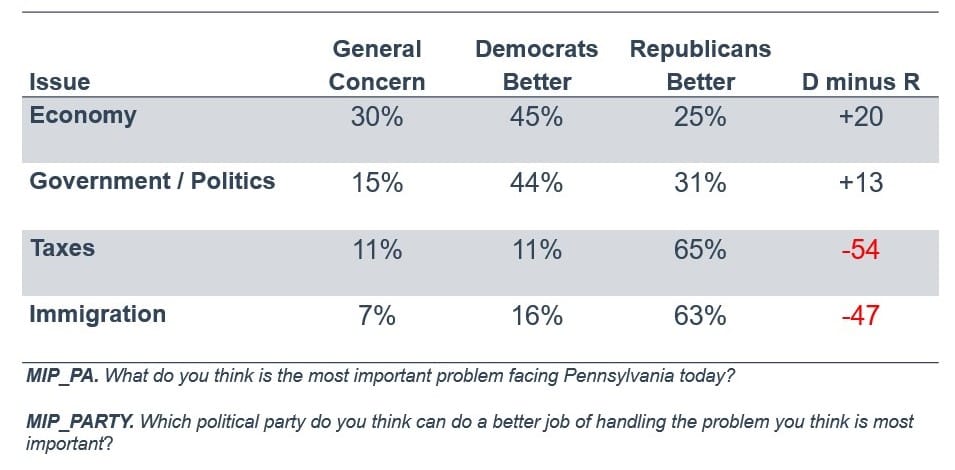
The economy is the top concern of voters, followed closely by concerns about governance, and more voters believe that Democrats will do a better job of addressing those issues than will Republicans (see Table 1). National data show that consumer confidence is as low as it was in 2022, which was a historical low point for consumer confidence going back to the late 1970s stagflation era. Higher prices have tanked consumer confidence.
Table 1. Pennsylvania voters’ top four concerns and party best able to address the issue
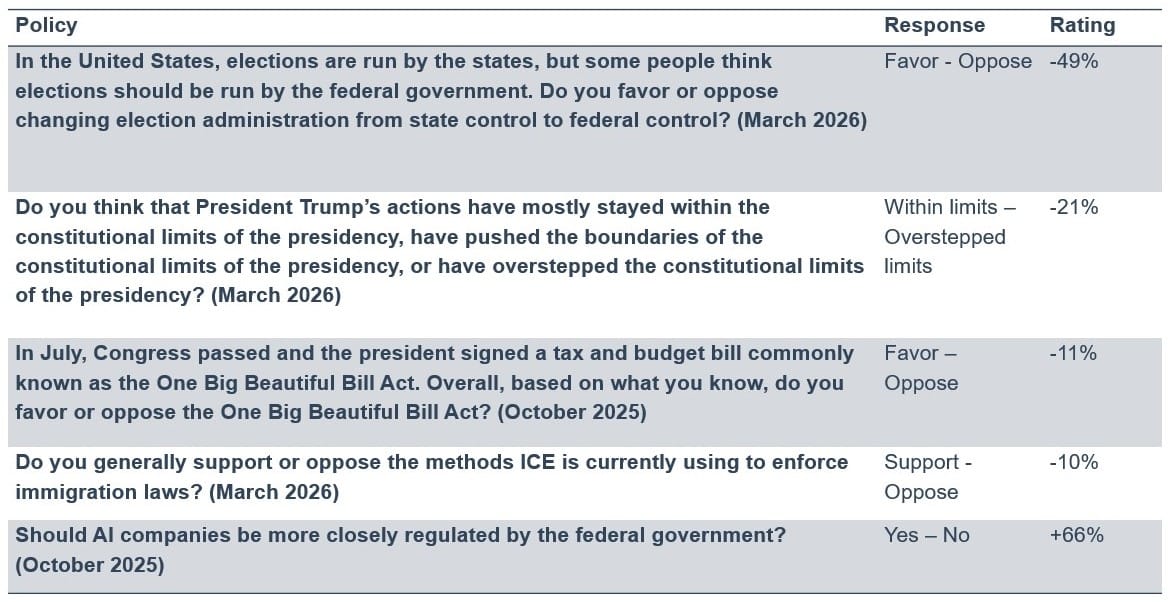
Republican candidates are also burdened by the unpopularity of the issue positions they’ve taken since President Trump returned to power. The president’s signature One Big Beautiful Bill was underwater with voters from the start, his policy positions around federal control of elections and AI regulation are deeply unpopular, and voters are concerned about the way he has pushed the constitutional limits of the presidency. His immigration policies are least unpopular, but still underwater. These gaps in public support for the policies passed or prioritized by the administration are shown in Table 2.
Table 2. Support for selected Trump administration policies, Pennsylvania
Conclusion
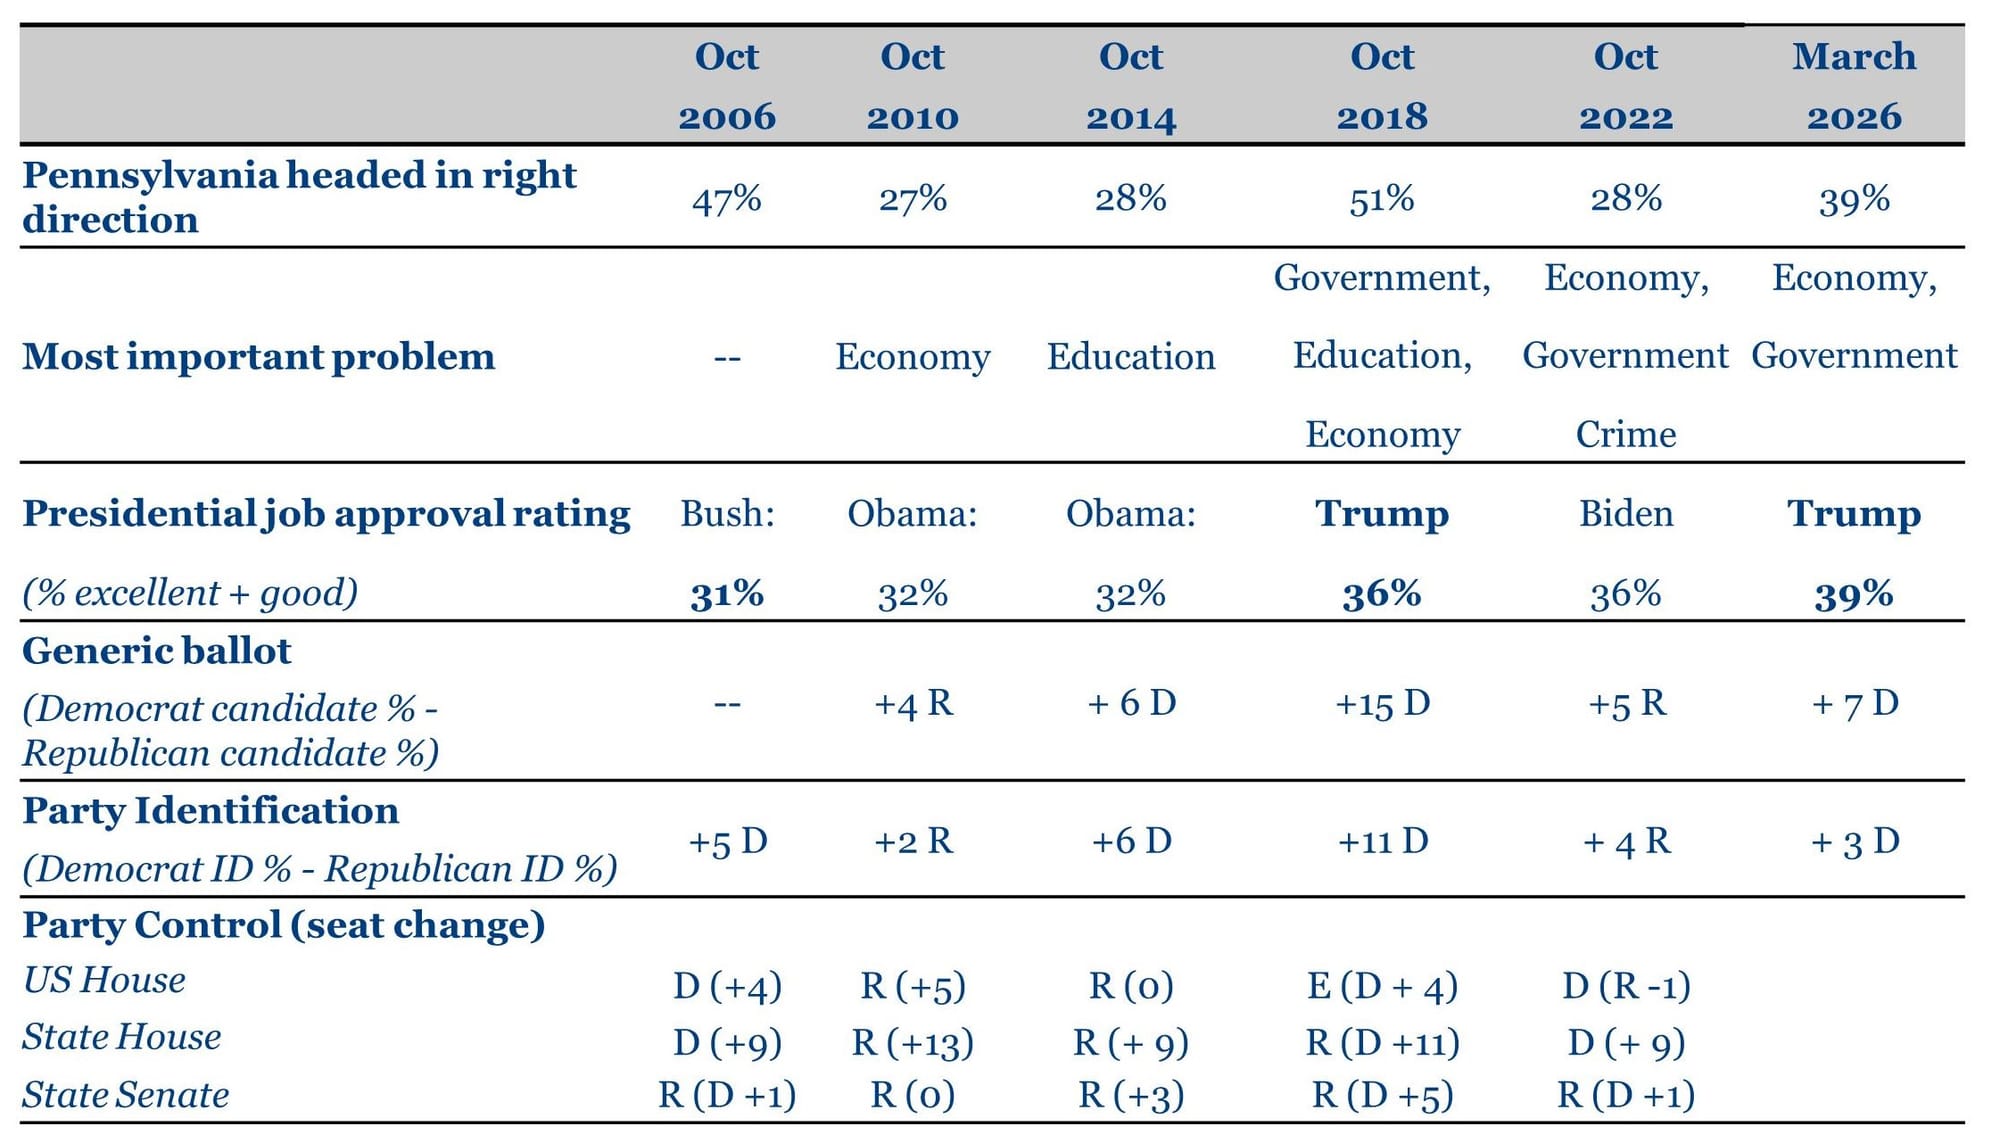
It is normal to see a loss of ideological support for the president’s party in midterm elections. In 2026, those normal patterns seem magnified by a turn in the policy mood, low presidential approval ratings, and an issue space that poses major impediments to Republican candidates. Specifically, Republicans are burdened by voters’ economic concerns, which are driven by inflation and high prices, and they trust Democrats more to address that concern. Table 3 summarizes these indicators and also shows the down ballot changes in the last five midterms in the state. This past midterm history suggests that Democratic gains in state and federal legislative races should be expected.
Table 3. Midterm election indicators, Pennsylvania
Endnotes
[i] The notion of a policy mood and its relationship to a thermostatic policy response is well described in Atkinson, M. L., Coggins, K. E., Stimson, J. A.., and Baumgartner, F. R. 2021. The Dynamics of Public Opinion. Cambridge: Cambridge University Press.
[ii] The American Presidency Project. “Seats in Congress Gained/Lost by the President's Party in Mid-Term Elections.” Santa Barbara, CA: University of California. Available online: https://www.presidency.ucsb.edu/node/332343/. The same pattern tends to hold in the Senate, although the dynamics of senate elections make the pattern a bit less certain than seen for US House races. The party in power lost US Senate seats in 13 of 20 elections since WWII. These changes also tend to filter into state level races too—democrats lost 948 state legislative seats during Obama’s presidency. (https://ballotpedia.org/Changes_in_state_legislative_seats_during_the_Obama_presidency)
[iii] Both the economy and presidential approval influence midterm outcomes although neither alone fully explains midterm outcomes. See for example, Grossman, M. and Wlezien, C. 2024. “A Thermostatic Model of Congressional Elections.” American Politics Research. Vol. S2(4): 355 – 366, and Bafumi, J., Erikson, R. S., and Wlezien, C. 2010. “Balancing, Generic Polls and Midterm Congressional Elections.” The Journal of Politics, Vol. 72 (3): 705 – 719. The latter article suggests that presidential approval at 30% would make it a predominant factor in midterm losses (p. 716).
Franklin & Marshall College Poll Newsletter
Join the newsletter to receive the latest updates in your inbox.