

Franklin & Marshall College Poll Release: August 2026
Pennsylvanians are experiencing significant economic stress and are increasingly unhappy with President Trump. We examined affordability, data centers and technology, the president's performance on key issues, and voter preferences in the upcoming midterm election.
Dear Readers,
I’m writing to share our summary report for the August 2026 Franklin & Marshall College Poll. I’ve highlighted a few of the key findings below, but I encourage you to read the full report, which is attached. The poll explores the mood of Pennsylvania voters and their positions on a number of contemporary technology issues in addition to their ratings of state political figures. The full report includes cross-tab tables as attachments for five key questions, including personal financial well-being, job approval ratings for Governor Shapiro and President Trump, ratings of the administration’s handling of inflation, and feelings about the personal effects of Trump administration policies.
If you want to learn more about the findings or ask questions about this poll, please join me and my colleague Stephen Medvic, the Honorable and Mrs. John C. Kunkel Professor of Government, at 6:30 pm on August 27, for a live conversation about the results. You can join by clicking this link.
Thank you for reading,
Berwood Yost
Key Findings
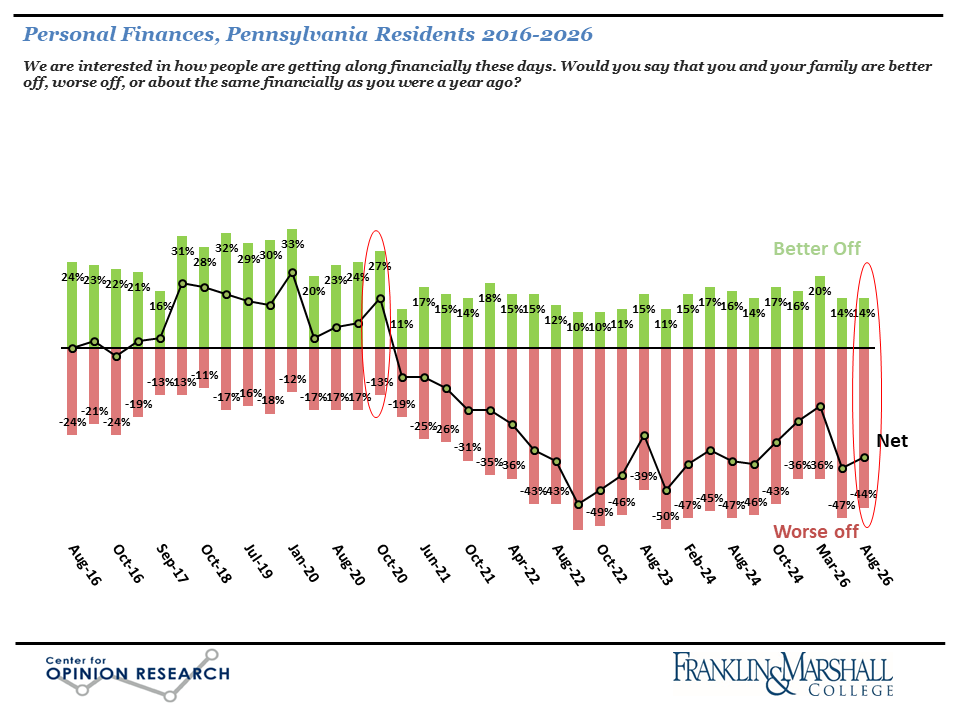
The August 2026 Franklin & Marshall College Poll finds that Pennsylvania’s registered voters are deeply concerned about their personal finances, experiencing significant economic stress, and increasingly dissatisfied with President Trump’s performance. Voters say the economy (31%) is the most important problem facing the state. Among those who mention economic problems, Democrats lead Republicans as the party that can best handle the issue, 47% to 23%, which is a larger advantage for Democrats than in June when it was 42% to 24%. The economy is the top concern of every partisan group. Nearly half (44%) of respondents say they are “worse off” financially than a year ago (Figure 1).
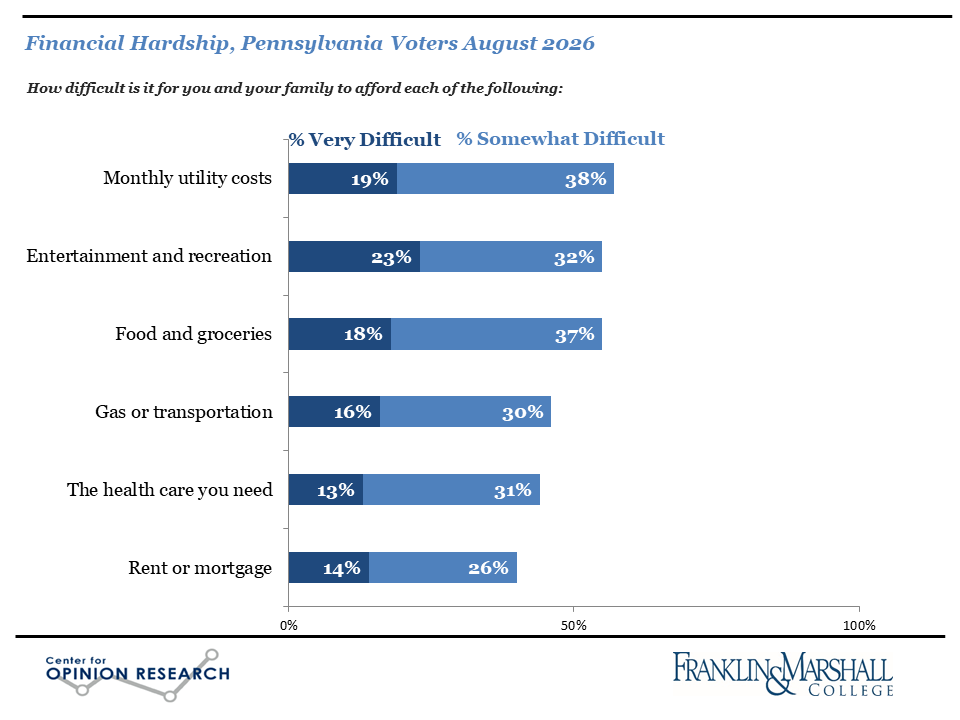
Economic pessimism and concern about the economy is a direct result of the difficulties the state’s registered voters have paying for necessities. For example, more than half of the state’s voters say it is “very difficult” or “somewhat difficult” to pay their utility bills (57%) or to pay for groceries (55%) (see Figure 2). Nearly four in five voters had at least some difficulty paying for one or more of these expenses, with sizable numbers of voters in all partisan groups, Republican (74%), Democrat (79%), and independent (71%), saying they had some difficulty paying for at least one of the six listed expenses.
State Politics
Governor Shapiro’s job approval ratings are holding up well considering how much pessimism voters express. About the same number of voters believe he is doing an “excellent” or “good” job (47%) as governor as believe he is doing a “fair” or “poor” job (47%). The race for governor has changed little since June, with Governor Shapiro leading his Republican challenger, Stacy Garrity, 50% to 25% in the 2026 governor’s race.
The survey included questions about artificial intelligence, data centers, and technology, and found that:
· More than four in five (84%) voters believes artificial intelligence companies should be more closely regulated by the federal government.
· Four in five (79%) opposes having a data center built in their community.
· More registered voters are “nervous” (76%) than “excited” (19%) about recent developments in artificial intelligence.
· Twice as many registered voters believe that technological changes like smartphones, social media, and artificial intelligence have been more negative (66%) than positive (31%) for society.
Presidential Ratings
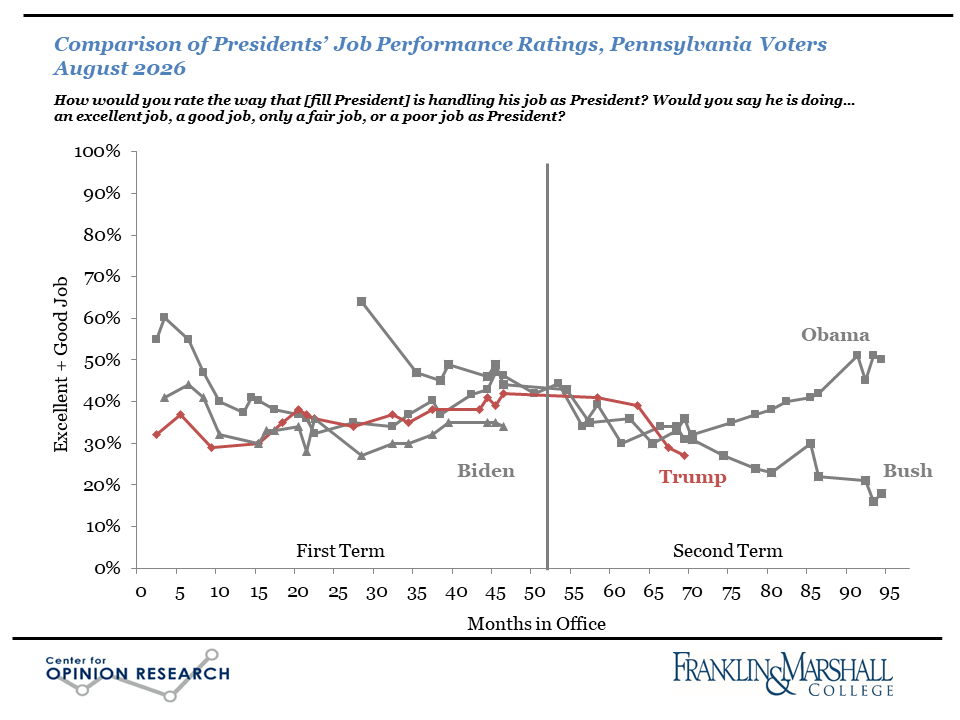
Fewer voters believe President Trump is doing an “excellent” or “good” job (27%) as president than believe he is doing a “fair” or “poor” job (73%), which is a sizable decline since our October poll when his positive approval rating was 41% (see Figure 3). President Trump’s positive approval rating among his base, white voters without a college degree (31%), has been declining and is now lower than Governor Shapiro’s rating (41%) among this group.
The president’s approval ratings for his specific policy actions around immigration, foreign affairs, and inflation have all declined since October. The Trump administration ratings for dealing with immigration slid from 47% “excellent” or “very good” in October to 38% now. The administration’s rating for handling foreign policy matters has declined from 42% to 26%. His largest proportional decline is for his administration’s handling of inflation, falling from 31% positive in October to 15% today. Only one in three (33%) registered voters believes that the president’s policies have helped them personally. Democrats currently lead Republicans by 12 points, 48% to 36%, in their preferences for the US House of Representatives.
Methodology
The survey findings presented in this release are based on the results of interviews conducted August 17 - 23, 2026. The interviews were conducted at the Center for Opinion Research at Franklin & Marshall College. The data included in this release represent the responses of 501 registered Pennsylvania voters, including 213 Democrats, 208 Republicans, and 80 independents.[1] The sample of voters was obtained from Aristotle. All sampled respondents were notified by mail about the survey. Interviews were completed over the phone and online depending on each respondent’s preference. Survey results were weighted (age, gender, education, geography, vote history, and party registration) using an iterative weighting algorithm to reflect the known distribution of those characteristics. Estimates for age, geography, and party registration are based on active voters within the Pennsylvania Department of State’s voter registration data. Gender and education are estimated using data from the November 2022 US Census Current Population Survey (CPS) Voter Registration Supplement.
The sample error for this survey is +/- 5.5 percentage points when the design effects from weighting are considered. The sample error for questions based on subgroups is larger. In addition to sampling error, this poll is also subject to other sources of non-sampling error. Generally speaking, two sources of error concern researchers most. Non-response bias is created when selected participants either choose not to participate in the survey or are unavailable for interviewing. Response errors are the product of the question and answer process. Surveys that rely on self-reported behaviors and attitudes are susceptible to biases related to the way respondents process and respond to survey questions.
Note: This poll was supported by a gift from F&M Alumnus Brett Harwood, Class of ’71.
[1] The data reported here is voter REGISTRATION and is consistent with past reporting practices. The survey also asked about self-reported voter IDENTIFICATION, which shows a slightly different partisan split: 38% identify as Republican (n=188), 12% as independent (n=58), 46% as Democrat (n=219) and the balance not offering a response. Partisan comparisons in this summary show self-reported registration.
Franklin & Marshall College Poll Newsletter
Join the newsletter to receive the latest updates in your inbox.