
The 2023 Municipal Election: Abortion Rights Likely Gave Democrats an Advantage
Turnout in Pennsylvania on November 7 was higher than expected, and Democrats won a race they had lost in 2021. We dig into the data to understand why.
Dear Readers,
This month we review vote returns from the 2023 municipal election. The data shows clear changes from the 2021 municipal election in voter preference and turnout. In terms of voter preference, most of the Southeastern and Southcentral counties, along with the Lehigh Valley, had an increase in Democratic vote share. In terms of raw turnout, the five counties with the largest increase in voter turnout also gave more of their votes to the Democratic candidate. The absence of exit poll data makes it hard to interpret the 2023 municipal election returns, but the emphasis on abortion rights probably helped drive both voter turnout and Democratic victories in 2023.
Thank you for reading,
Berwood Yost
The race to elect a justice to the State Supreme Court was the most high profile race in the state this election cycle. Our pre-election preview showed that most voters did not know much about the candidates, and that Republicans seemed more likely to vote than Democrats, meaning the electorate was likely to be more conservative than registered voters as a whole. The question headed into Election Day was whether the race was going to be more about voters’ judgments of the president’s performance or more about abortion rights. Despite the Republican tilt we saw among the likely electorate, our preview also showed that more than four in five likely voters supported abortion rights, including a sizable share of likely Republican voters.
Overall Results
The outcome solidified the Democrats’ hold on the State Supreme Court and also provided generally favorable outcomes for Democrats throughout the State. In normal times, the unpopularity of an incumbent president would have meant a dismal showing for his party’s candidates. The share of Pennsylvania voters who rated the president’s performance as excellent or good was only 30% as Election Day approached, which was no better than his ratings in October 2021 (32%) when his party lost a state Supreme Court seat. But those dismal numbers didn’t seem to matter much this time.
Turnout among the state’s registered voters (39.2%) was relatively high for a municipal election, with Democrat Daniel McCaffery beating Republican Carolyn Carluccio by seven points, 53.5% to 46.5%. Turnout was 31.7% for the Supreme Court race in 2021 when Republican Kevin Brobson beat Democrat Maria McLaughlin by less than one point, 49.6% to 50.4%.
County-Level Voting
Figure 1 provides a simple comparison of the county-level results for the Democratic candidate’s vote share in 2021 compared to 2023. Dots that fall along the diagonal red line in Figure 1 had no change in Democratic vote share and dots above the red line gave a larger share of their vote to McCaffery in 2023 than McLaughlin in 2021. McCaffery won a larger vote share than McLaughlin in 48 of the state’s 67 counties. Four counties (blue dots) flipped their party preference: Berks, Bucks, and Dauphin counties flipped from Republican to Democrat, while Erie County went from Democrat to Republican. Notably, the change in turnout at the county level from the 2021 race showed that turnout tended to increase as Democratic vote share increased (r = 0.22).
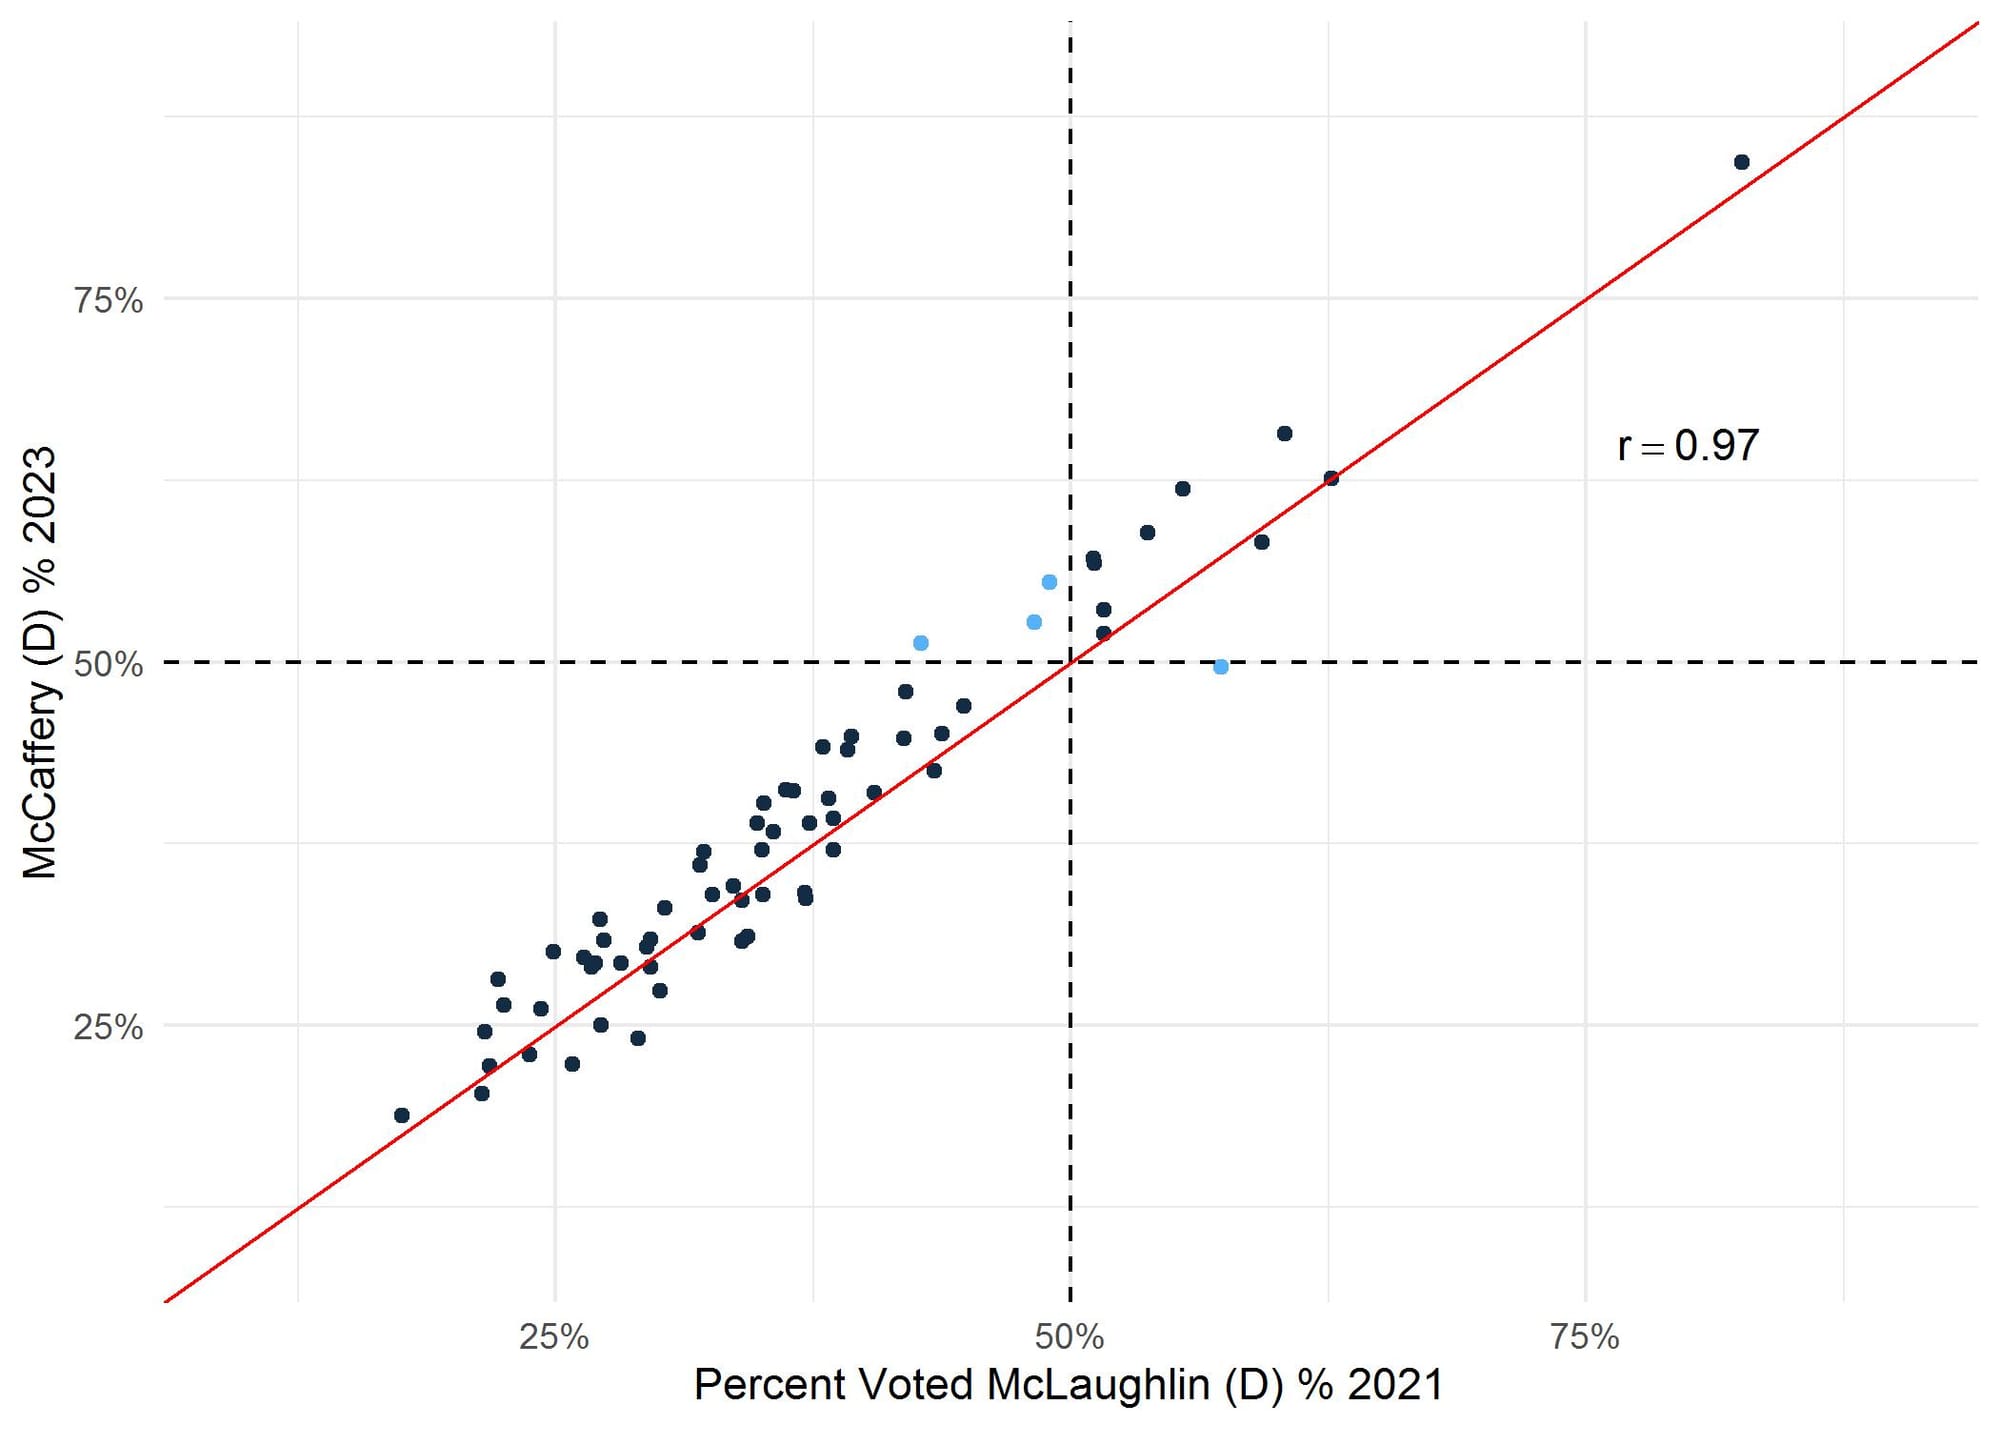
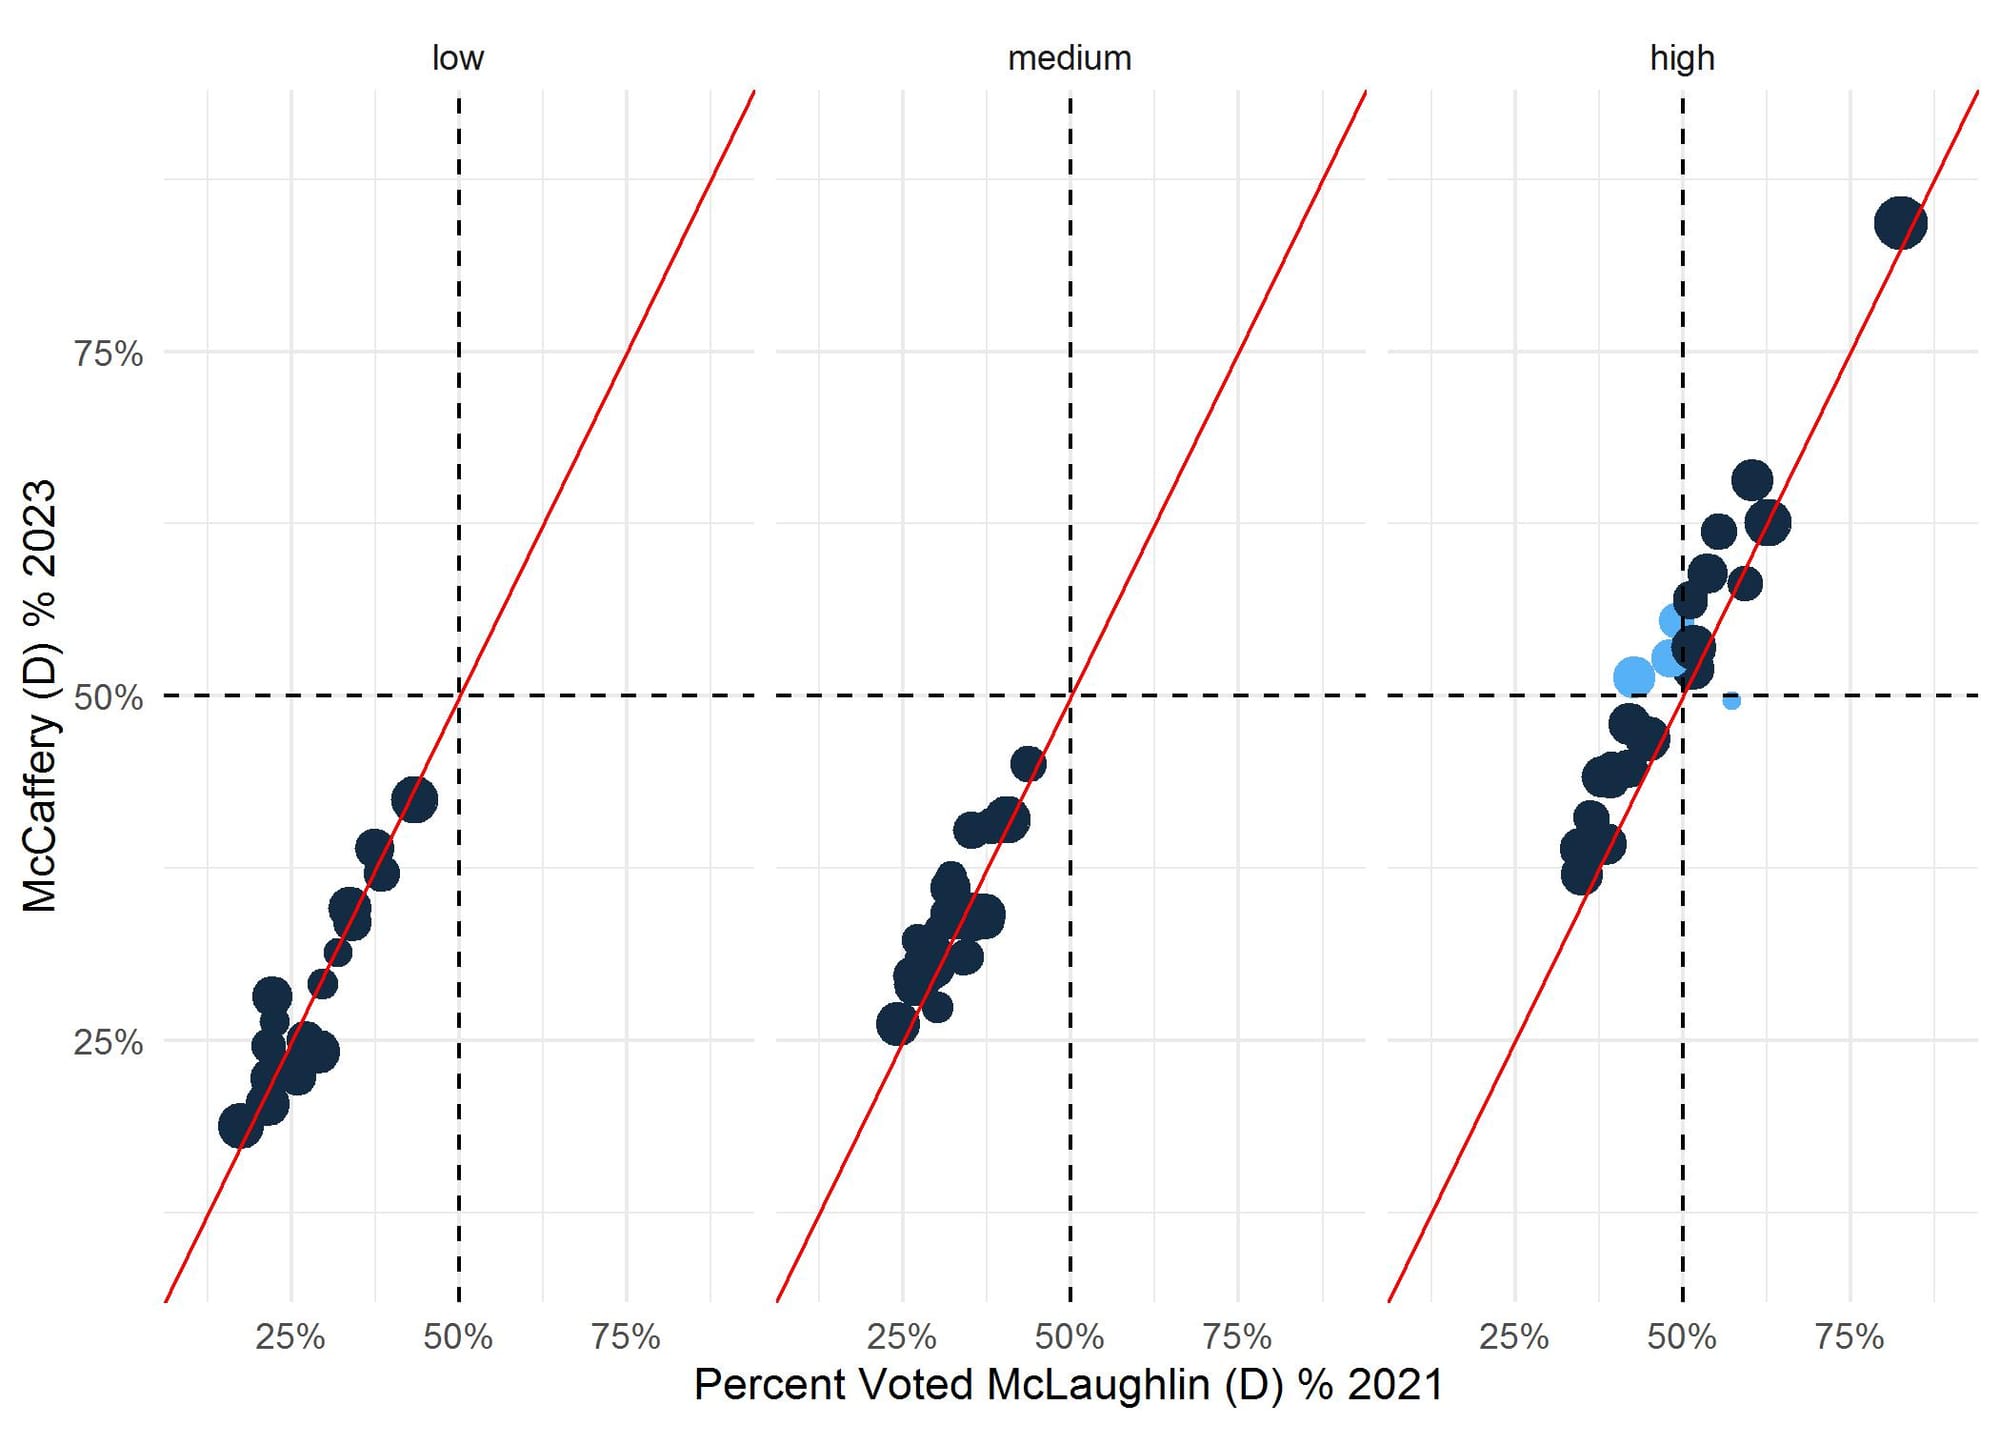
Correlations in county-level vote shares tend to be high from election to election. Figure 1 showed, for instance, that the correlation between the democratic vote share in 2021 and 2023 was 0.97. A second factor strongly correlated with county-level vote was educational attainment. The correlation between the proportion of adults with a college degree and the democratic vote share within a county was nearly as high as the 2021 vote share (r = 0.78).[1] Figure 2 shows how county-level educational attainment relates to change in support for the Democratic candidate from 2021 to 2023. Most of the largest increases in Democratic vote share came in counties with the highest level of education (those counties with more than a third of adults with a college degree or higher), and all four of the counties that flipped party preference are in the high attainment group.
The story of the race is pretty clear in terms of voter preference and turnout. In terms of voter preference, most of the Southeastern and Southcentral counties, along with the Lehigh Valley, saw an increase of about five percent or more in the share of the vote they gave to the Democratic candidate. In terms of raw turnout, the five counties with the largest increase in voter turnout also gave more of their votes to the Democratic candidate than in 2021.[2]
Campaign Spending
The Supreme Court candidates spent very little on advertising: Democrats and aligned groups spent about $10.4 million and Republicans and their allies spent $7.7 million, according to AdImpact, a political agency that tracks media spending and messaging. By comparison, the campaigns in the 2022 U.S. Senate race in Pennsylvania spent $312.1 million on that race.[3] Democrats spent more money in Southeastern and Southwestern Pennsylvania than Republicans, but Republicans outspent them in the other parts of the state (see Table 1).
Table 1: Vote Share and Campaign Spending by Region, Pennsylvania Supreme Court Race 2023
|
Region |
McCaffery Vote |
Carluccio Vote |
Total Vote |
McCaffery % |
Democratic Ad Spending |
Republican Ad Spending |
Democratic Ad Share |
|
Central |
317,170 |
456,485 |
773,655 |
41.0 |
$759,205 |
$979,961 |
43.7 |
|
Northeast |
178,261 |
167,357 |
345,618 |
51.6 |
$707,570 |
$1,144,367 |
38.2 |
|
Northwest |
98,560 |
158,573 |
257,133 |
38.3 |
$132,802 |
$313,953 |
29.7 |
|
Southeast |
708,860 |
343,105 |
1,051,965 |
67.4 |
$5,353,136 |
$2,394,380 |
69.1 |
|
Southwest |
348,915 |
309,273 |
658,188 |
53.0 |
$3,043,923 |
$2,736,943 |
52.7 |
Note: Southeast region includes Philadelphia and Southwest region includes Allegheny County. Source for ad spending data is AdImpact.
It doesn’t appear that differences in regional ad spending were closely related to regional vote shares, maybe because of the small amount of spending. The Erie results are somewhat perplexing: McCaffery lost his race by 435 votes while Democrats won easy victories in the Superior Court, Commonwealth Court, Court of Common Pleas, and Controller races in Erie. Some have speculated that the difference in advertising spending in the Northwest advertising market created an advantage for Carluccio, but how likely is it that a difference in ad spending of about $200,000 would have such an effect? Then again, Erie County cast 7,000 fewer votes in the 2023 Supreme Court race than it did in the 2021 contest, so more advertising spending could have increased interest in the race among Erie County voters.
Comparisons to 2020
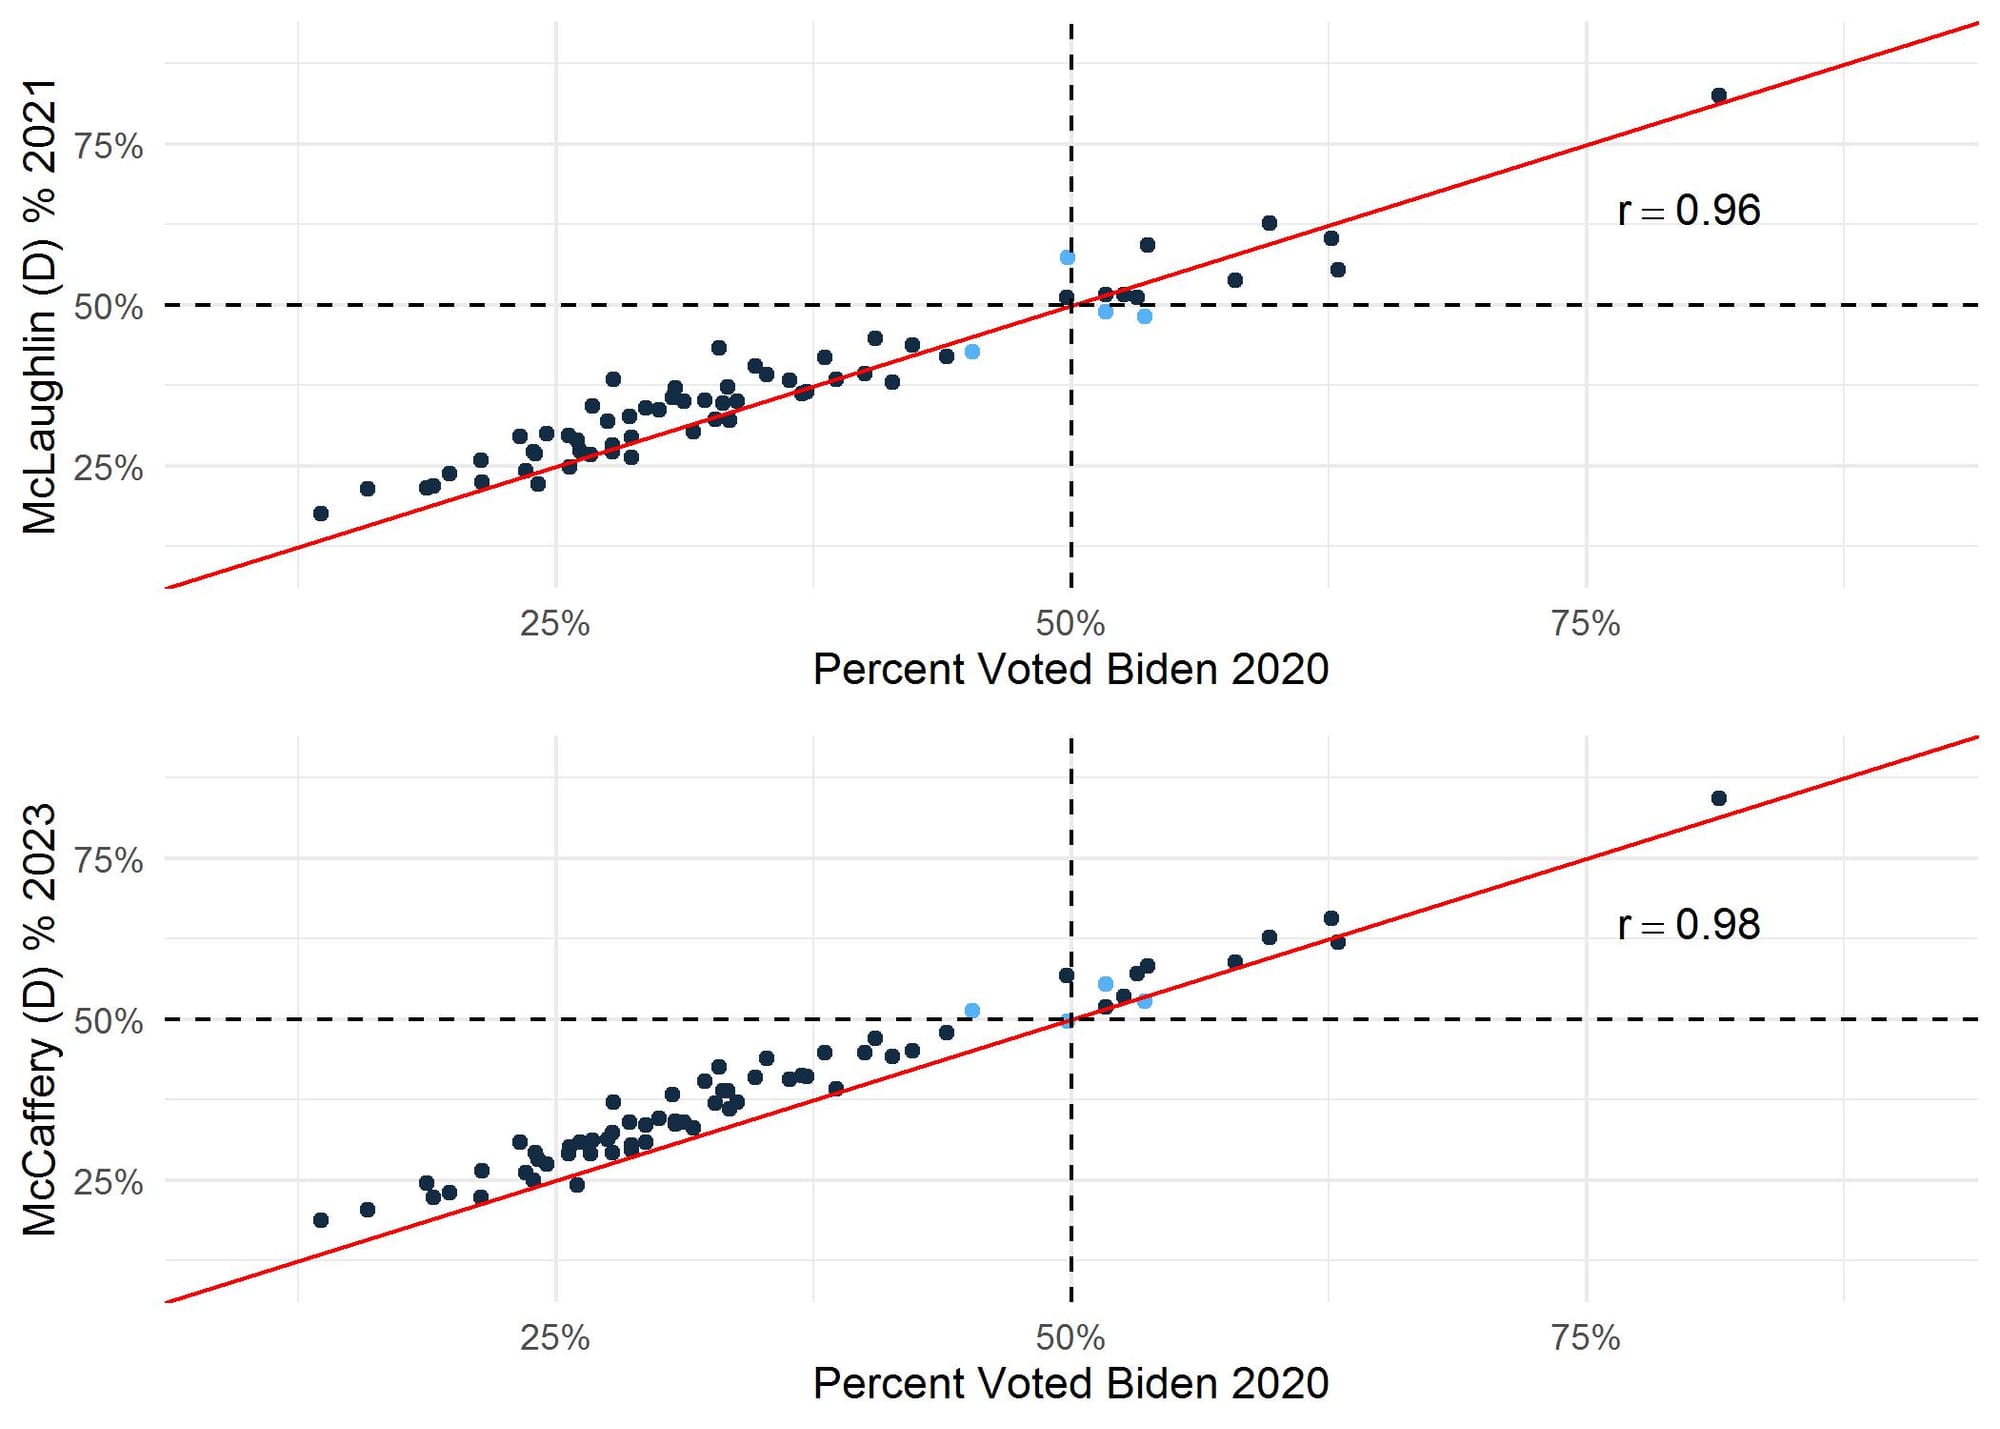
McCaffery ran ahead of President Biden’s 2020 vote share in 63 of the state’s 67 counties. In 2021, McLaughlin ran ahead of President Biden in 45 counties, which wasn’t sufficient to ensure her victory. Figure 3 compares the county-level vote shares for McCaffery and McLaughlin compared to President Biden. The likely lynchpin for McCaffery’s easy win was running ahead of Biden in most of the 13 counties Biden won in 2020, which was something McLaughlin failed to do. These advantages were mainly in urban and suburban counties, particularly those in the Southeast and Lehigh valley, as noted above.
Wrapping Up
The absence of exit poll data makes it hard to interpret the 2023 municipal election returns, and interpretations based on county-level data can overstate the importance of some findings, but it is probably safe to say that the emphasis on abortion rights helped drive both voter turnout and Democratic victories in 2023 given how much and where county vote shares and turnout changed. Democrat Dan McCaffery outran Joe Biden in almost every county in the state and his advantage was particularly pronounced in suburban counties with larger shares of college graduates. Joe Biden’s unpopularity, which was even lower in 2023 than in 2021, was not a drag on McCaffery.
So it seems that abortion rights may have provided Democrats with an advantage in 2023 as it did in 2022. As I said in a prior newsletter, “What makes the abortion issue most perilous for Republicans right now, at least in Pennsylvania, is that even Republican-leaning voters think that Democrats’ views on abortion are more in line with majority opinion. This is the only instance where partisan leaners think the other party better represents majority opinion.”
Does this give President Biden and other Democrats running in Pennsylvania a leg up in their races? Perhaps, but let’s not forget that the 2021 municipal election was of little use in predicting the 2022 mid-terms. Then again, the past two election cycles suggest that at least some voters are thinking about more than just the candidates on the ballot and the president’s performance as they make their choices. The current assemblage of emotionally-laden issues has reinforced partisan branding in the last two cycles that has helped Democrats. What, if anything, will change that in 2024?
[1] More formally, a multiple regression analysis was run to predict the county-level vote share for the Democratic Supreme Court candidate from 2021 Democratic vote share and college attainment for each county. These variables predicted the 2023 democratic vote share (F(2, 64)=635.1, p. < .001, adj. R2=.95) and both added significantly to the prediction, p. < .05.
[2] The counties with the largest increase in total votes cast compared to 2021 are Philadelphia (78,645), Allegheny (66,501), Montgomery (28,883), Chester (15,016), and Lancaster (12,340).
[3] AdImpact’s 2022 Political Cycle-In-Review
Franklin & Marshall College Poll Newsletter
Join the newsletter to receive the latest updates in your inbox.