
2024 Primary Recap: Protest Votes and Other Surprises
An analysis of the unexpected outcomes in the 2024 Pennsylvania primary election. We look at how the protest vote, turnout, and geography influenced the results, and what this might mean for the upcoming general election.
Dear Subscribers,
The 2024 primary races in Pennsylvania delivered some surprising results. This month’s newsletter provides some thoughts about those surprises and what they likely mean for the fall election.
Thank you for reading,
Berwood Yost
There were few public polls conducted for the April 2024 Pennsylvania primary races because the races at the top of the ticket for president and U.S. Senate were uncontested. And despite contested primaries for the state row offices in both parties, there was little public polling about them. Pollsters have few incentives to poll in low-information races where the candidates are mostly unknown and when determining who will vote is hard to do. Whatever the reasons, the lack of polling data provided the backdrop for two surprises that are worth thinking about before turning our attention to November.
The Protest Vote
Both President Biden and Mr. Trump lost votes to opponents who had given up campaigning. At the latest count, nearly 17 percent of Republicans preferred Nikki Haley to Mr. Trump, and nearly 7 percent of Democrats chose Dean Phillips over President Biden.[1]
The patterns of county-level support for former president Trump continued to demonstrate his weakness with suburban voters, particularly in the southeast and south central parts of the state. He lost between 20 and 25 percent of the vote in these areas. President Biden for his part showed weaknesses in more rural counties, losing between 15 and 20 percent of the vote in the ten counties where he had his worst performances.
You may have heard this one before, but Mr. Trump has troubles with suburban voters and President Biden doesn’t do well with rural voters. That seems to be true not just in the electorate at large, but within their parties too. Whether the data comes from survey data or from this primary, it is evident that both candidates have issues within their bases they will need to fix before November.
Will these defections mean anything for the fall? In 2004, incumbent Arlen Specter squeaked by Pat Toomey in the Republican primary, 51% to 48%, but still won easily in November. The same was true in 2012, when first-term incumbent Bob Casey’s Democratic challenger Joe Vodvarka drew 19% of the vote.
The McClelland Surprise
There was also real surprise that the Democratic Party’s endorsed candidate for treasurer, Ryan Bizzarro, lost handily to challenger Erin McClelland, 54% to 46%. But this “surprise outcome” can be explained by differences in regional turnout and with state voters’ tendency to prefer candidates who live closer to them.
Turnout
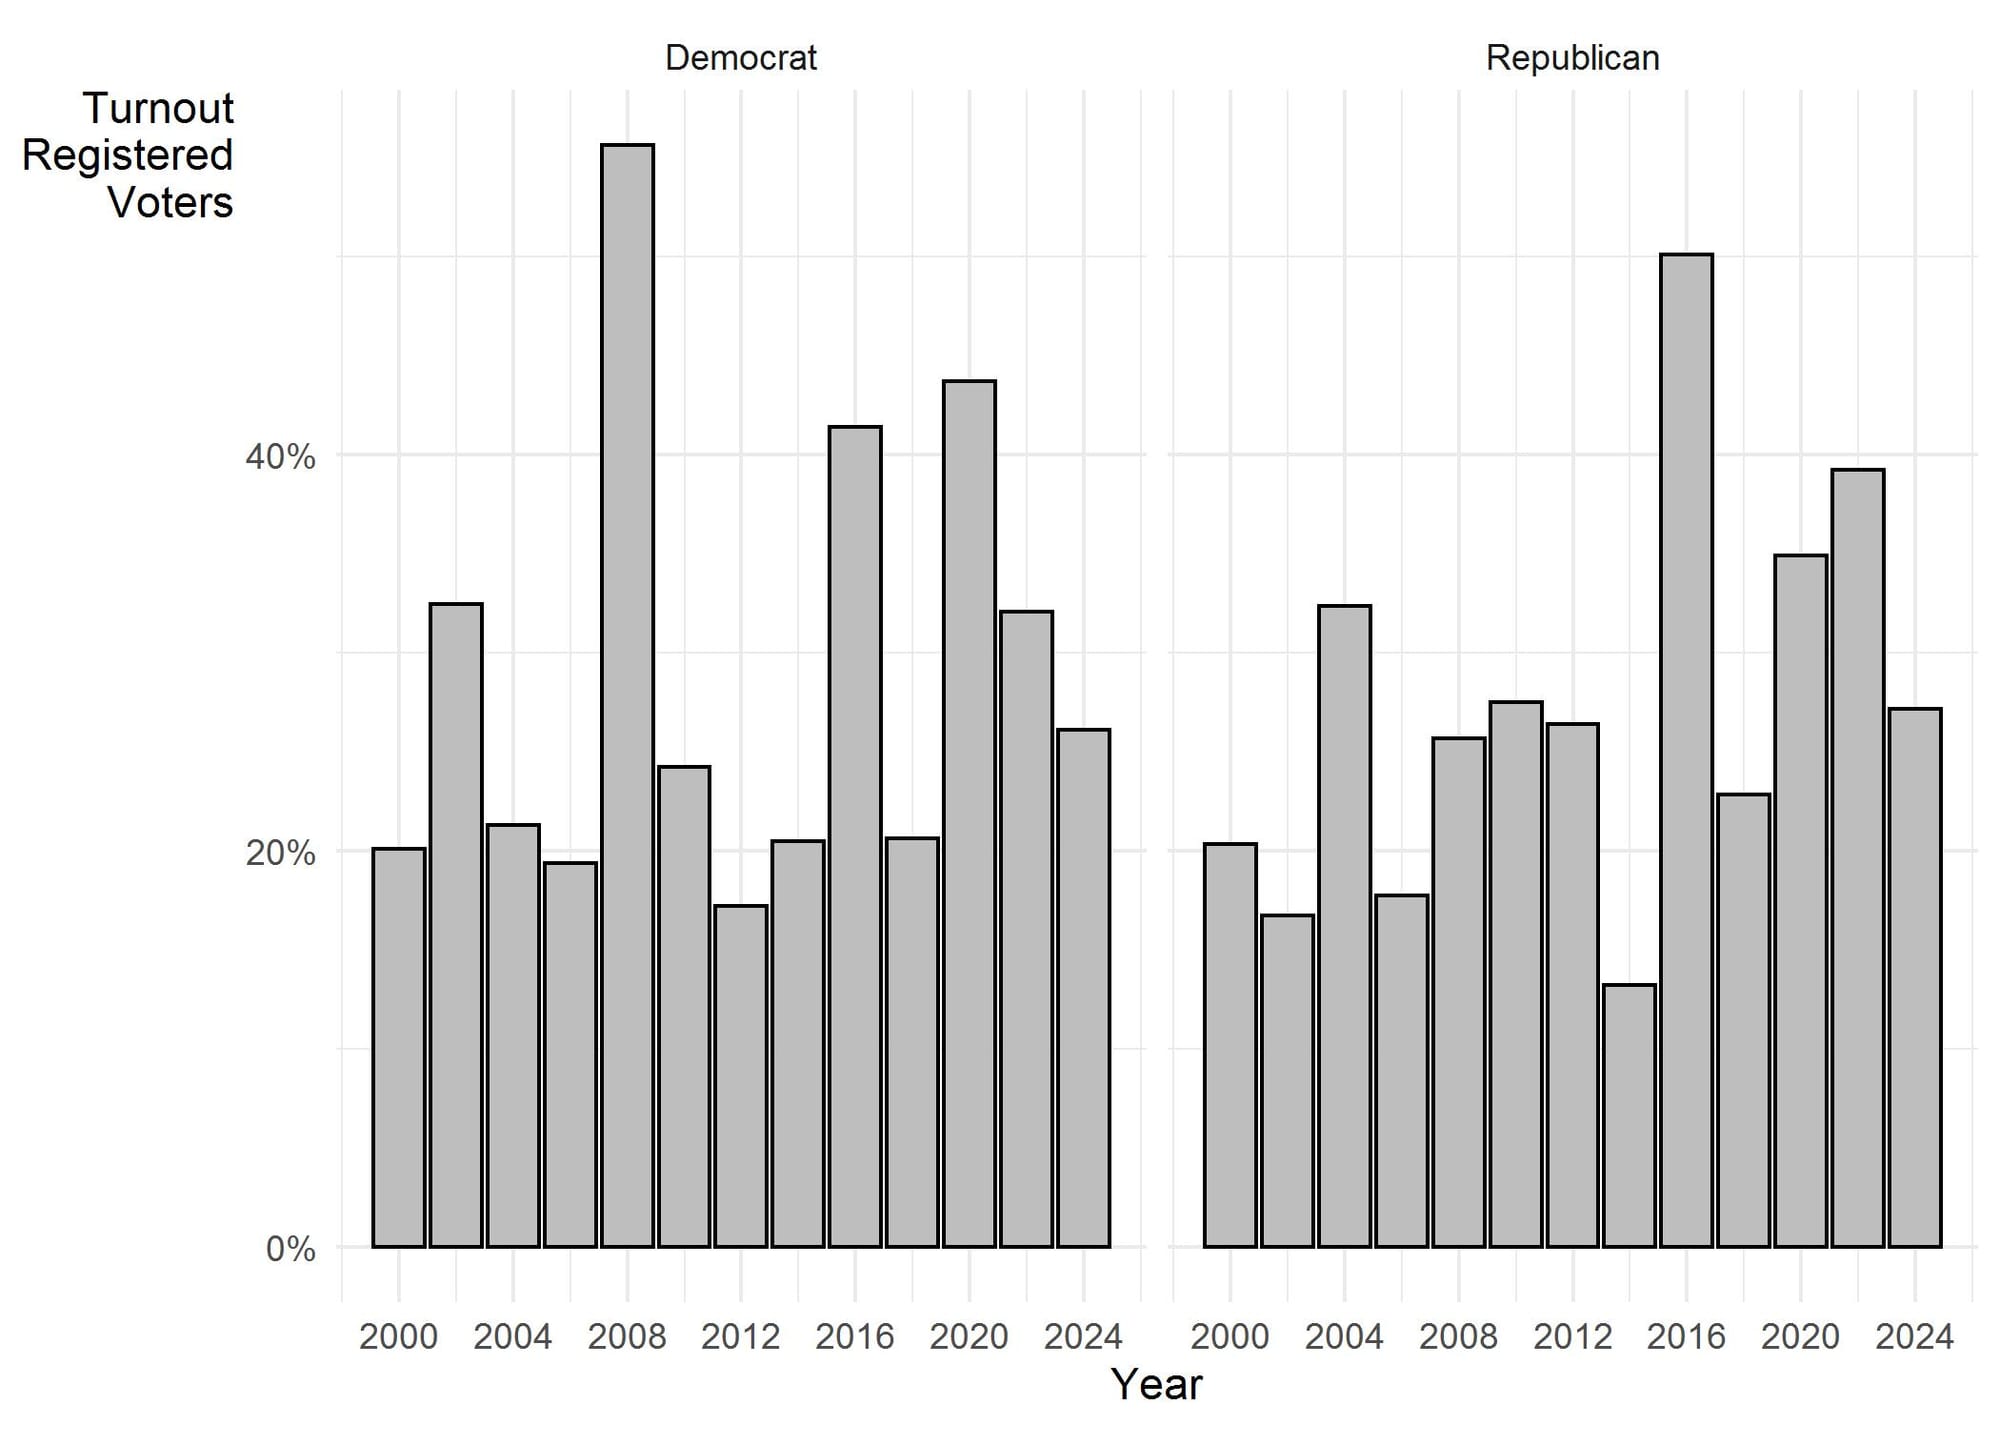
Primary election turnout in Pennsylvania is normally low, averaging 27 percent of registered Republicans and 29 percent of registered Democrats in even numbered years since 2000.[2] Figure 1 shows the primary election turnout among registered voters in both parties. Higher voter turnout is typically associated with more competitive primaries, which meant this year’s uncontested races for senate and president gave voters less incentive to show up at the polls. As Figure 1 shows, turnout was the lowest since mail-in voting was adopted during the 2020 primaries, representing 27 percent of registered Republicans and 26 percent of registered Democrats.
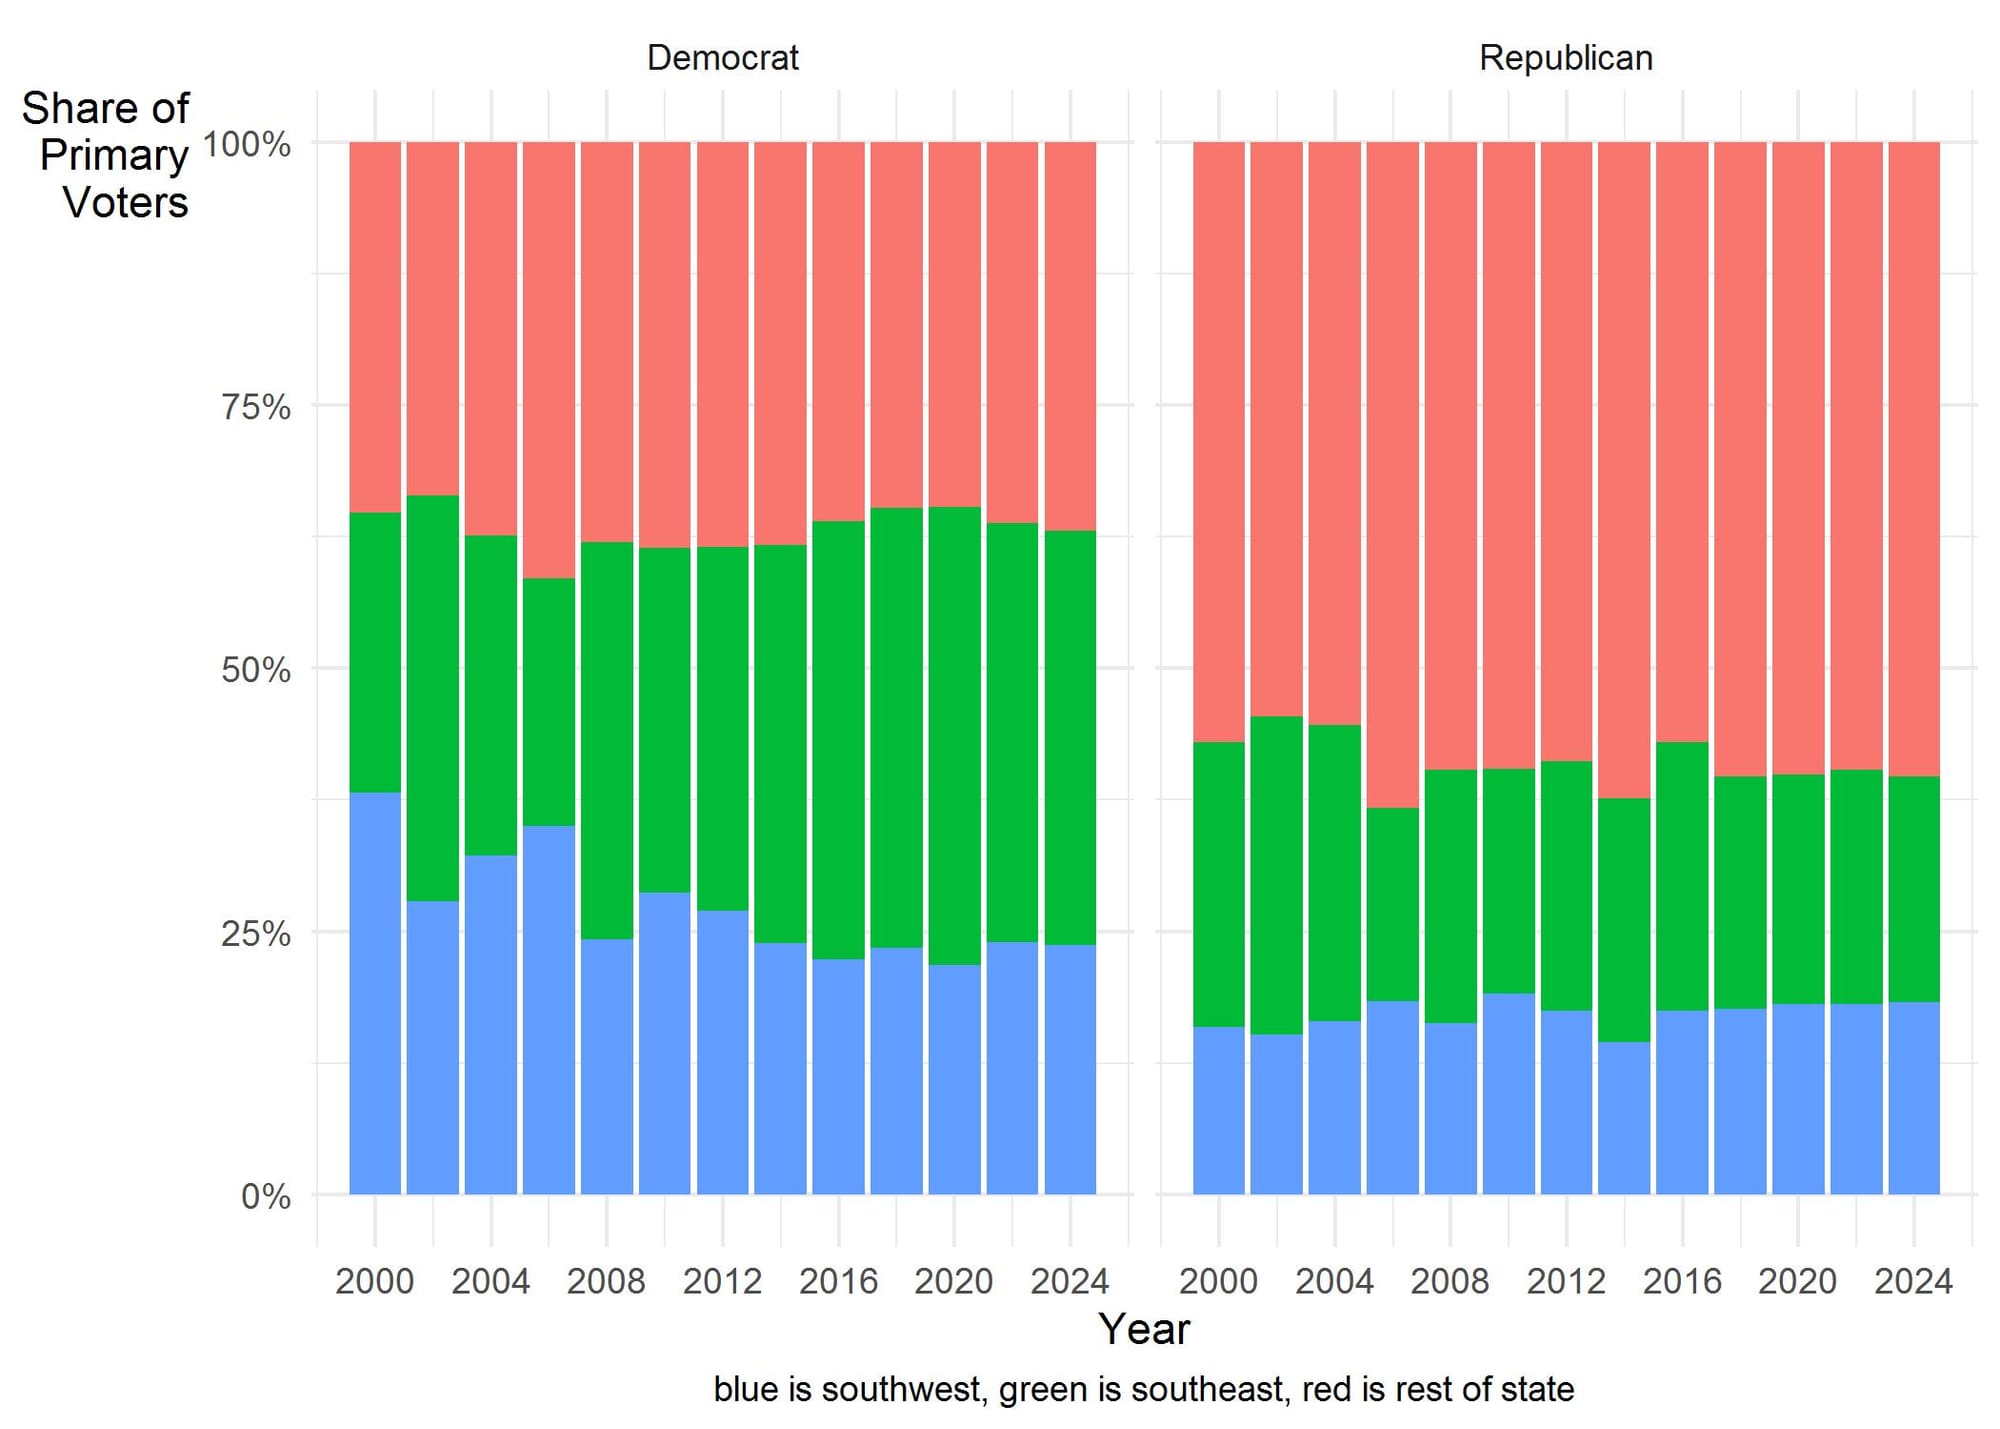
Even though southwestern Pennsylvania plays a smaller role in state Democratic primaries than it did in 2000 (see Figure 2), Allegheny County itself continues to be vote rich. In this particular election, Allegheny County had more Democratic primary voters than any other county, about 160,000, which represented about 17 percent of all Democratic primary voters. Keep this in mind.
County of Residence
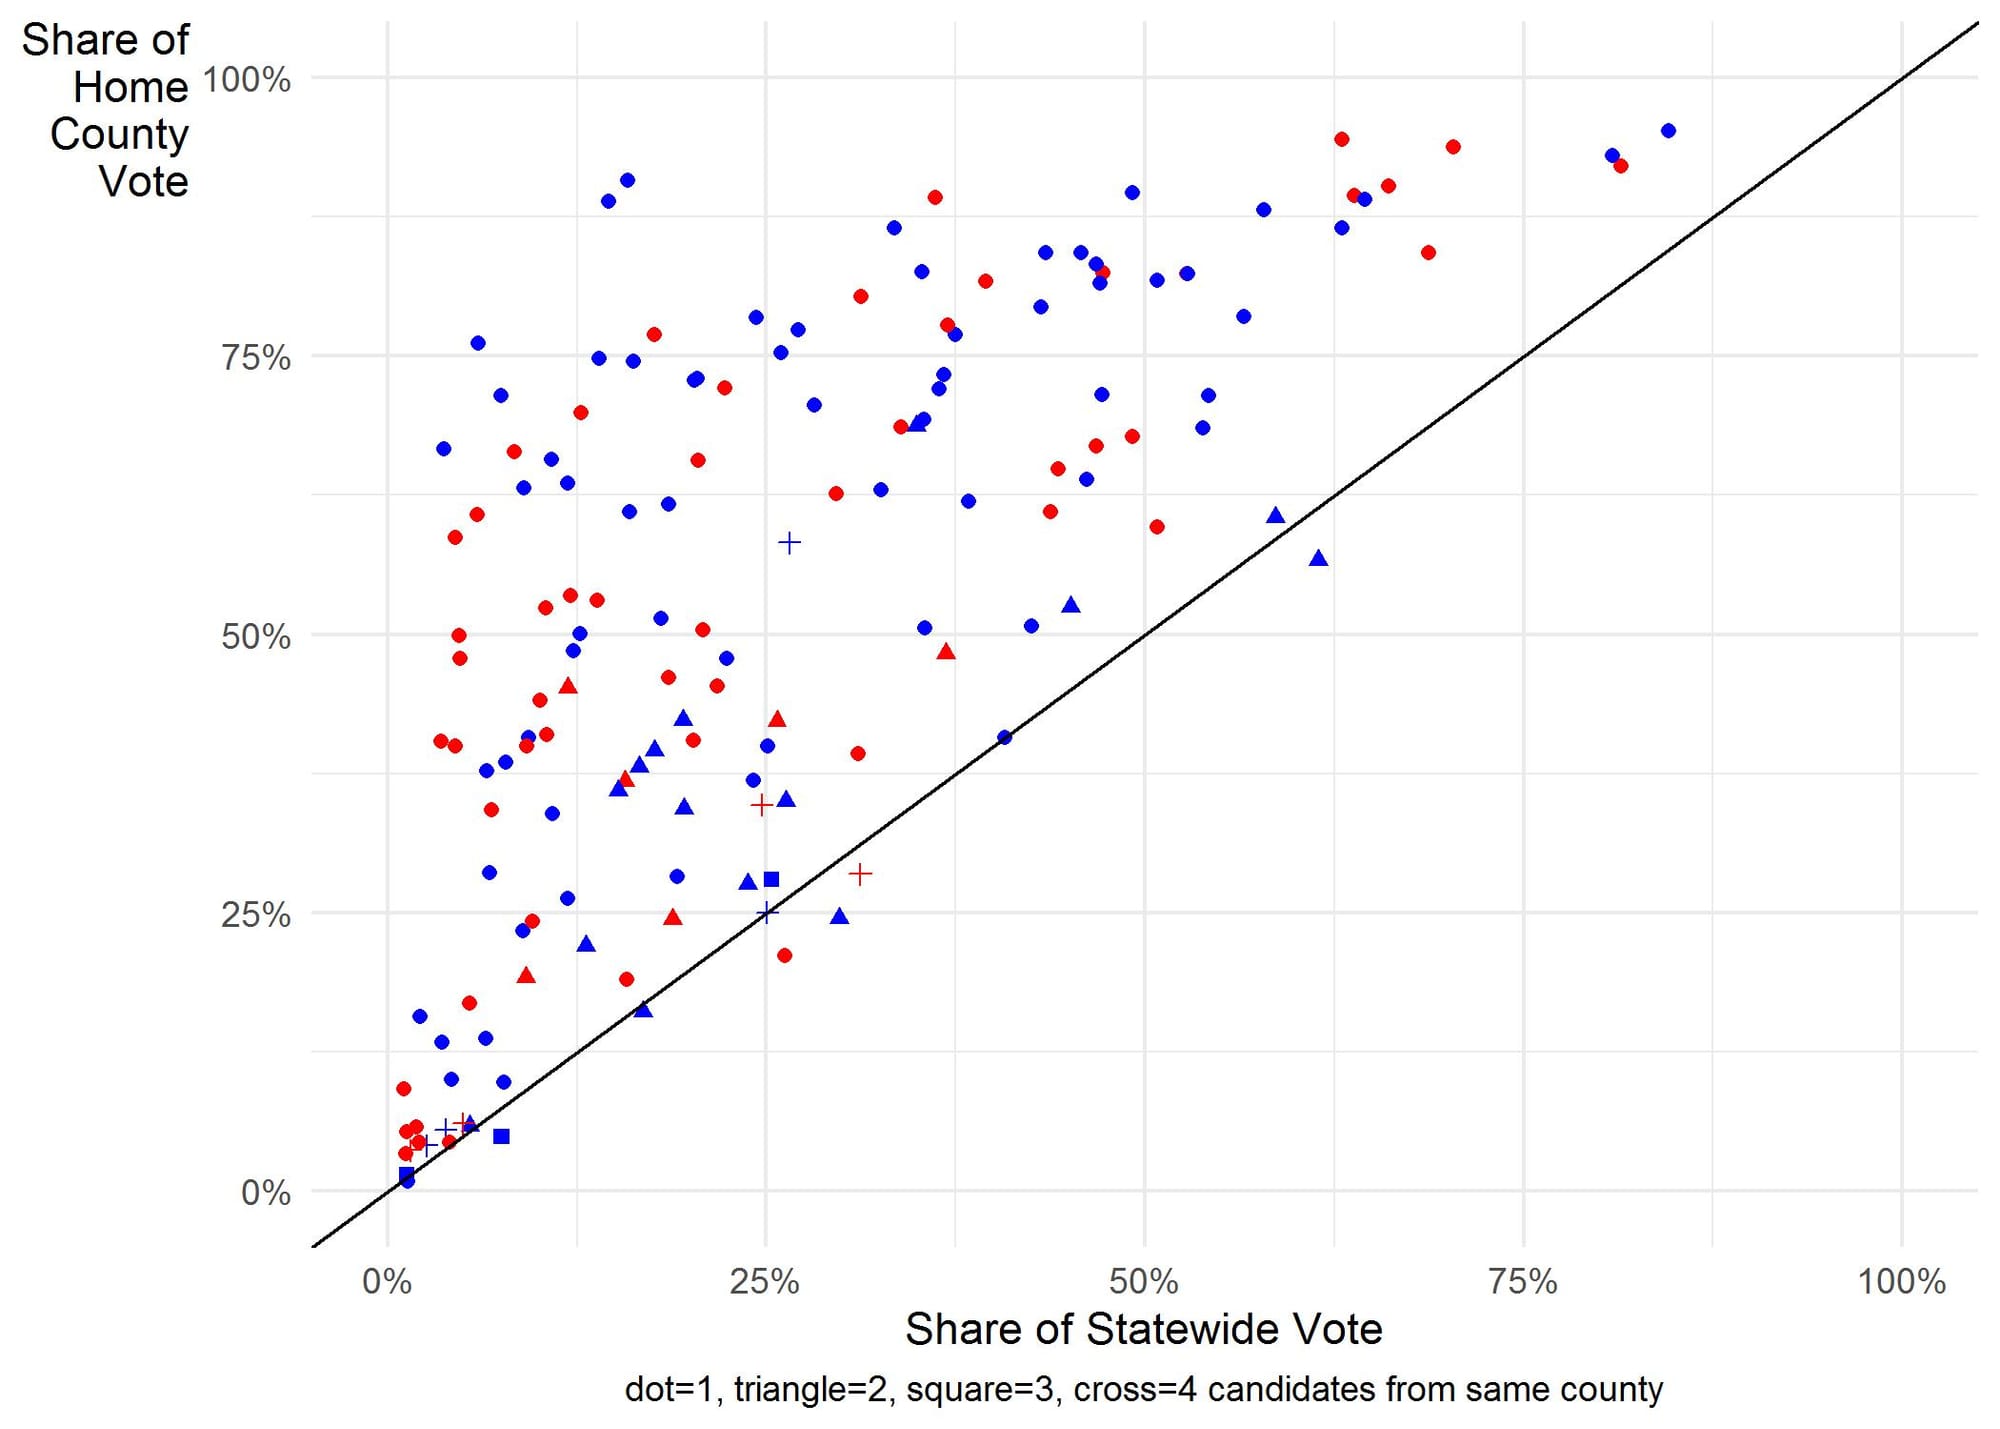
Voters often use information shortcuts to make decisions. Of course, the most important shortcut, party identification, is unavailable to voters in primary elections since all the candidates on a given voter’s ballot share the same party. Instead, some Pennsylvania voters will likely rely on a unique feature of the state’s ballot, namely, the candidate's county of residence that appears beside each candidate's name. The results of recent primary elections in the state show that primary candidates receive about half of the vote share in their home counties, although that declines if there is more than one candidate in the race from the same county. Figure 3 shows the statewide share of the primary vote in comparison to the share of the vote a candidate received in their home county listed on the ballot.[3] Any marker that appears above the diagonal line means that the candidate won a larger share of their home county vote than their share from the entire state vote.
In this primary, Erin McClelland won more than 70% of the vote in the most vote rich county in the state, which happens to be her county of residence. She also did well in those counties that surround Allegheny County. And though many did not see Eugene DePasquale’s victory in the attorney general’s race as a surprise, he was also the beneficiary of regional voting as he, too, had Allegheny on the ballot as his home county.[4] Like McClelland, DePasquale captured about 70% of the Allegheny County vote and also had strong support in its surrounding counties.
DePasquale also had something else working in his favor: his ballot position was second out of five candidates. Just as a candidate’s county of residence is a piece of information a voter can use in making their vote decision, so is a candidate’s ballot position. Political scientists have found that candidates benefit from being listed first on the ballot, with the effect largest in primaries where voters lack a lot of information about the candidates. While ballot position is less important in a two-candidate race like state treasurer, it becomes more important in races with longer lists of candidates. Being further down the list of candidates tends to have a depressing effect on vote share. [5]
Conclusion
Primary elections often produce unexpected outcomes. Without a partisan cue to guide their decisions, voters turn to other available sources of information. For the row office races, it is likely that some combination of regional turnout differences, county of residence, and ballot position influenced the “surprising” outcomes in those races.
The size of the “protest vote” in both presidential primary outcomes also came as a surprise. The protest vote reinforces what we know about the major party candidates: there are a lot of voters who would prefer different candidates. The returns in the presidential primary also reinforce the geographic patterns that have been apparent in our state politics for years, further confirming how much work both candidates have ahead of them. That work includes shoring up their bases and, given the low turnout, getting people interested in the election.
Notes
[1] The election data was downloaded on April 28, 2024 from the Pennsylvania Department of State’s vote returns web site. The results do not include write in votes for candidates not listed on the ballot.
[2] This means that a larger share of Democratic voters will be progressive, and that a larger share of Republican voters will be conservative, within each respective primary, and this could have implications for the viability of a candidate come November. The election turnout data for Figures 1 and 2 was compiled by the author using data provided by the Pennsylvania Department of State, specifically the Election Results and Voting & Election Statistics pages found here.
[3] The data used to create the image is based on every contested statewide primary in the state in even-numbered years between 2000 and 2024 (n=151 candidates, 89 Democrats and 62 Republicans). The data was compiled by the author from state election returns and county of residence was determined from state campaign committee filings.
[4] DePasquale was elected twice to statewide office, serving as the state treasurer from 2013 – 2021. The Democratic Party did not endorse any candidate for attorney general.
[5] In Pennsylvania, a candidate’s position on a primary ballot is determined randomly.
Franklin & Marshall College Poll Newsletter
Join the newsletter to receive the latest updates in your inbox.