
Demographic, Attitudinal, and Electoral Changes in Pennsylvania Partisans Since 2000
We review some long-term trends in the partisan alignment of the state's voters, looking at demographic and attitudinal sorting, geographic realignment, and two issues--gun control and abortion. What does this mean for the state's electoral politics?
Dear Readers,
This month we review some long-term trends in the partisan alignment of the state’s voters by selected demographic, social, and policy indicators, and what this means for the state’s electoral politics. The data suggests there are some subtle changes to the overall orientation of the state’s electorate that accompany the profound changes in the regional reorganization of the state’s voters that has taken place since 2000. Seeing these trends should give you additional context for interpreting the many “what happened in 2022 to predict 2024” analyses that keep popping up.
You can expect to see the results of our next statewide survey in late August.
Thank you for reading,
Berwood Yost
I am working on a chapter for a forthcoming book about Pennsylvania politics and public policy that focuses on changes to the state’s politics since the turn of the century. The chapter is too long to fit into a short newsletter, but there are a few findings that may interest people outside the narrow sliver of academics the book will reach. This article documents two related trends that have had a meaningful effect on the state’s politics since 2000: 1) the demographic and attitudinal sorting that has driven social polarization in the state, and 2) the geographic realignment of voter registration that is a consequence of that sorting.
Demographic and Attitudinal Changes Among Partisans
The data presented in this section are based on the aggregated responses for selected questions asked in Franklin & Marshall College Polls among Pennsylvania registered voters in 2000 (n=1,752) and 2022 (n=3,726).[i]
Table 1 reveals that the state’s parties are more homogenous and less diverse because partisans have sorted themselves demographically and socially. The most consequential realignments have been among ideological, religious, and educational groups. The identity-based ideology measured in our polls shows that Republicans have become much more conservative since 2000, with the proportion of Republicans who identify as conservative rising from 49% to 70%. Democrats who identify as liberal has risen from 31% to 40% while the proportion who identify as conservative declined from 21% to 9%, but a plurality of Democrats (46%) still see themselves as moderate.
Republicans are also more aligned with Protestant denominations than previously, while Democrats are less aligned with either Protestant or Catholic denominations. Republicans who identify as Protestant increased from 30% to 42%, while the share of Democrats who identify as unaffiliated with a Catholic or Protestant religious doctrine has grown from 26% to 51%. Fewer Democrats identify as military veterans (12% to 8%), while more Republicans are gun owners (36% to 54%). Finally, a larger share of Democrats now claims a college degree (32% to 49%).
Table 1. Demographic and Social Characteristics of Pennsylvania Registered Voters by Party Registration, 2000 and 2022
|
|
Party Registration |
|||||||
|
Republican |
Democrat |
Other |
||||||
|
2000 |
2022 |
2000 |
2022 |
2000 |
2022 |
|||
|
Ideology |
Liberal |
9% |
2% |
31% |
40% |
22% |
13% |
|
|
Moderate |
37% |
24% |
43% |
46% |
45% |
57% |
||
|
Conservative |
49% |
70% |
21% |
9% |
24% |
21% |
||
|
Born-Again/ |
Yes |
41% |
35% |
30% |
13% |
22% |
15% |
|
|
No |
54% |
63% |
64% |
85% |
70% |
83% |
||
|
Veteran |
Yes |
14% |
15% |
12% |
8% |
12% |
16% |
|
|
No |
86% |
85% |
88% |
92% |
88% |
84% |
||
|
Gun Owner |
Yes |
36% |
54% |
26% |
25% |
30% |
43% |
|
|
No |
64% |
46% |
73% |
74% |
70% |
56% |
||
|
Race |
White |
95% |
90% |
82% |
81% |
83% |
82% |
|
|
Nonwhite |
3% |
10% |
16% |
19% |
12% |
18% |
||
|
Gender |
Male |
44% |
53% |
35% |
39% |
55% |
61% |
|
|
Female |
56% |
47% |
65% |
61% |
45% |
38% |
||
|
Age |
Under 35 |
19% |
7% |
20% |
14% |
33% |
20% |
|
|
35-54 |
44% |
32% |
45% |
33% |
54% |
36% |
||
|
Over 55 |
38% |
60% |
35% |
53% |
13% |
45% |
||
|
Religion |
Protestant |
30% |
42% |
41% |
23% |
32% |
24% |
|
|
Catholic |
54% |
29% |
33% |
26% |
31% |
22% |
||
|
Other, unaffiliated |
16% |
29% |
26% |
51% |
37% |
54% |
||
|
Marital Status |
Single, Never Married |
17% |
13% |
21% |
27% |
25% |
26% |
|
|
Married |
67% |
65% |
62% |
50% |
60% |
56% |
||
|
Not currently married |
16% |
22% |
17% |
23% |
15% |
18% |
||
|
Education |
No College Degree |
63% |
65% |
68% |
51% |
60% |
53% |
|
|
College Degree |
37% |
35% |
32% |
49% |
40% |
47% |
||
|
Note: bold type indicates significant difference between 2000
and 2022 in a partisan group at p. < .001; italics indicates significant
difference at p. < .05. |
||||||||
The realignment of broad policy-related preferences for gun control and abortion access have followed the sorting of demographic and social identities. Table 2 shows policy preferences for these two symbolic and divisive issues. The share of Republicans who favor gun control laws has shrunk this century, falling from about half (51%) to about one quarter (29%). During the same time span, the share of Democrats who favor more gun control has risen substantially from two in three (66%) to four in five (82%). Half as many Republicans support abortion rights with no limitations (20% to 10%) as did in 2000, while nearly twice as many Democrats believe abortion should be available under any circumstance, rising from one-quarter (27%) to over one half (52%). While specific policy proposals for each of these issues could yield different levels of partisan support, broadly speaking the middle policy ground has eroded for most partisans. This partisan sorting has shuffled the state’s political map.
Table 2. Attitudes about Gun Regulation and Abortion Rights Among Pennsylvania Registered Voters by Party Registration, 2000 and 2022
|
|
Party Registration |
|||||||
|
Republican |
Democrat |
Other |
||||||
|
2000 |
2022 |
2000 |
2022 |
2000 |
2022 |
|||
|
Generally speaking, do you favor or oppose
creating more laws that regulate gun ownership? |
Strongly favor |
31% |
14% |
48% |
65% |
33% |
30% |
|
|
Somewhat favor |
20% |
15% |
18% |
17% |
22% |
19% |
||
|
Somewhat oppose |
14% |
17% |
10% |
6% |
16% |
15% |
||
|
Strongly oppose |
27% |
51% |
17% |
8% |
24% |
32% |
||
|
Do not know |
8% |
2% |
8% |
3% |
6% |
4% |
||
|
Do you think that
abortion should be legal under any circumstances, legal under certain
circumstances, or illegal in all circumstances? |
Legal under any
circumstances |
20% |
10% |
27% |
52% |
35% |
37% |
|
|
Legal under certain circumstances |
54% |
65% |
52% |
43% |
44% |
55% |
||
|
Illegal in all
circumstances |
22% |
23% |
16% |
4% |
15% |
7% |
||
|
Do not know |
5% |
2% |
5% |
2% |
6% |
1% |
||
|
Note: bold type indicates significant difference between 2000
and 2022 in a partisan group at p. < .001; italics indicates significant
difference at p. < .05. |
||||||||
Regional Voter Registration Change since 2000
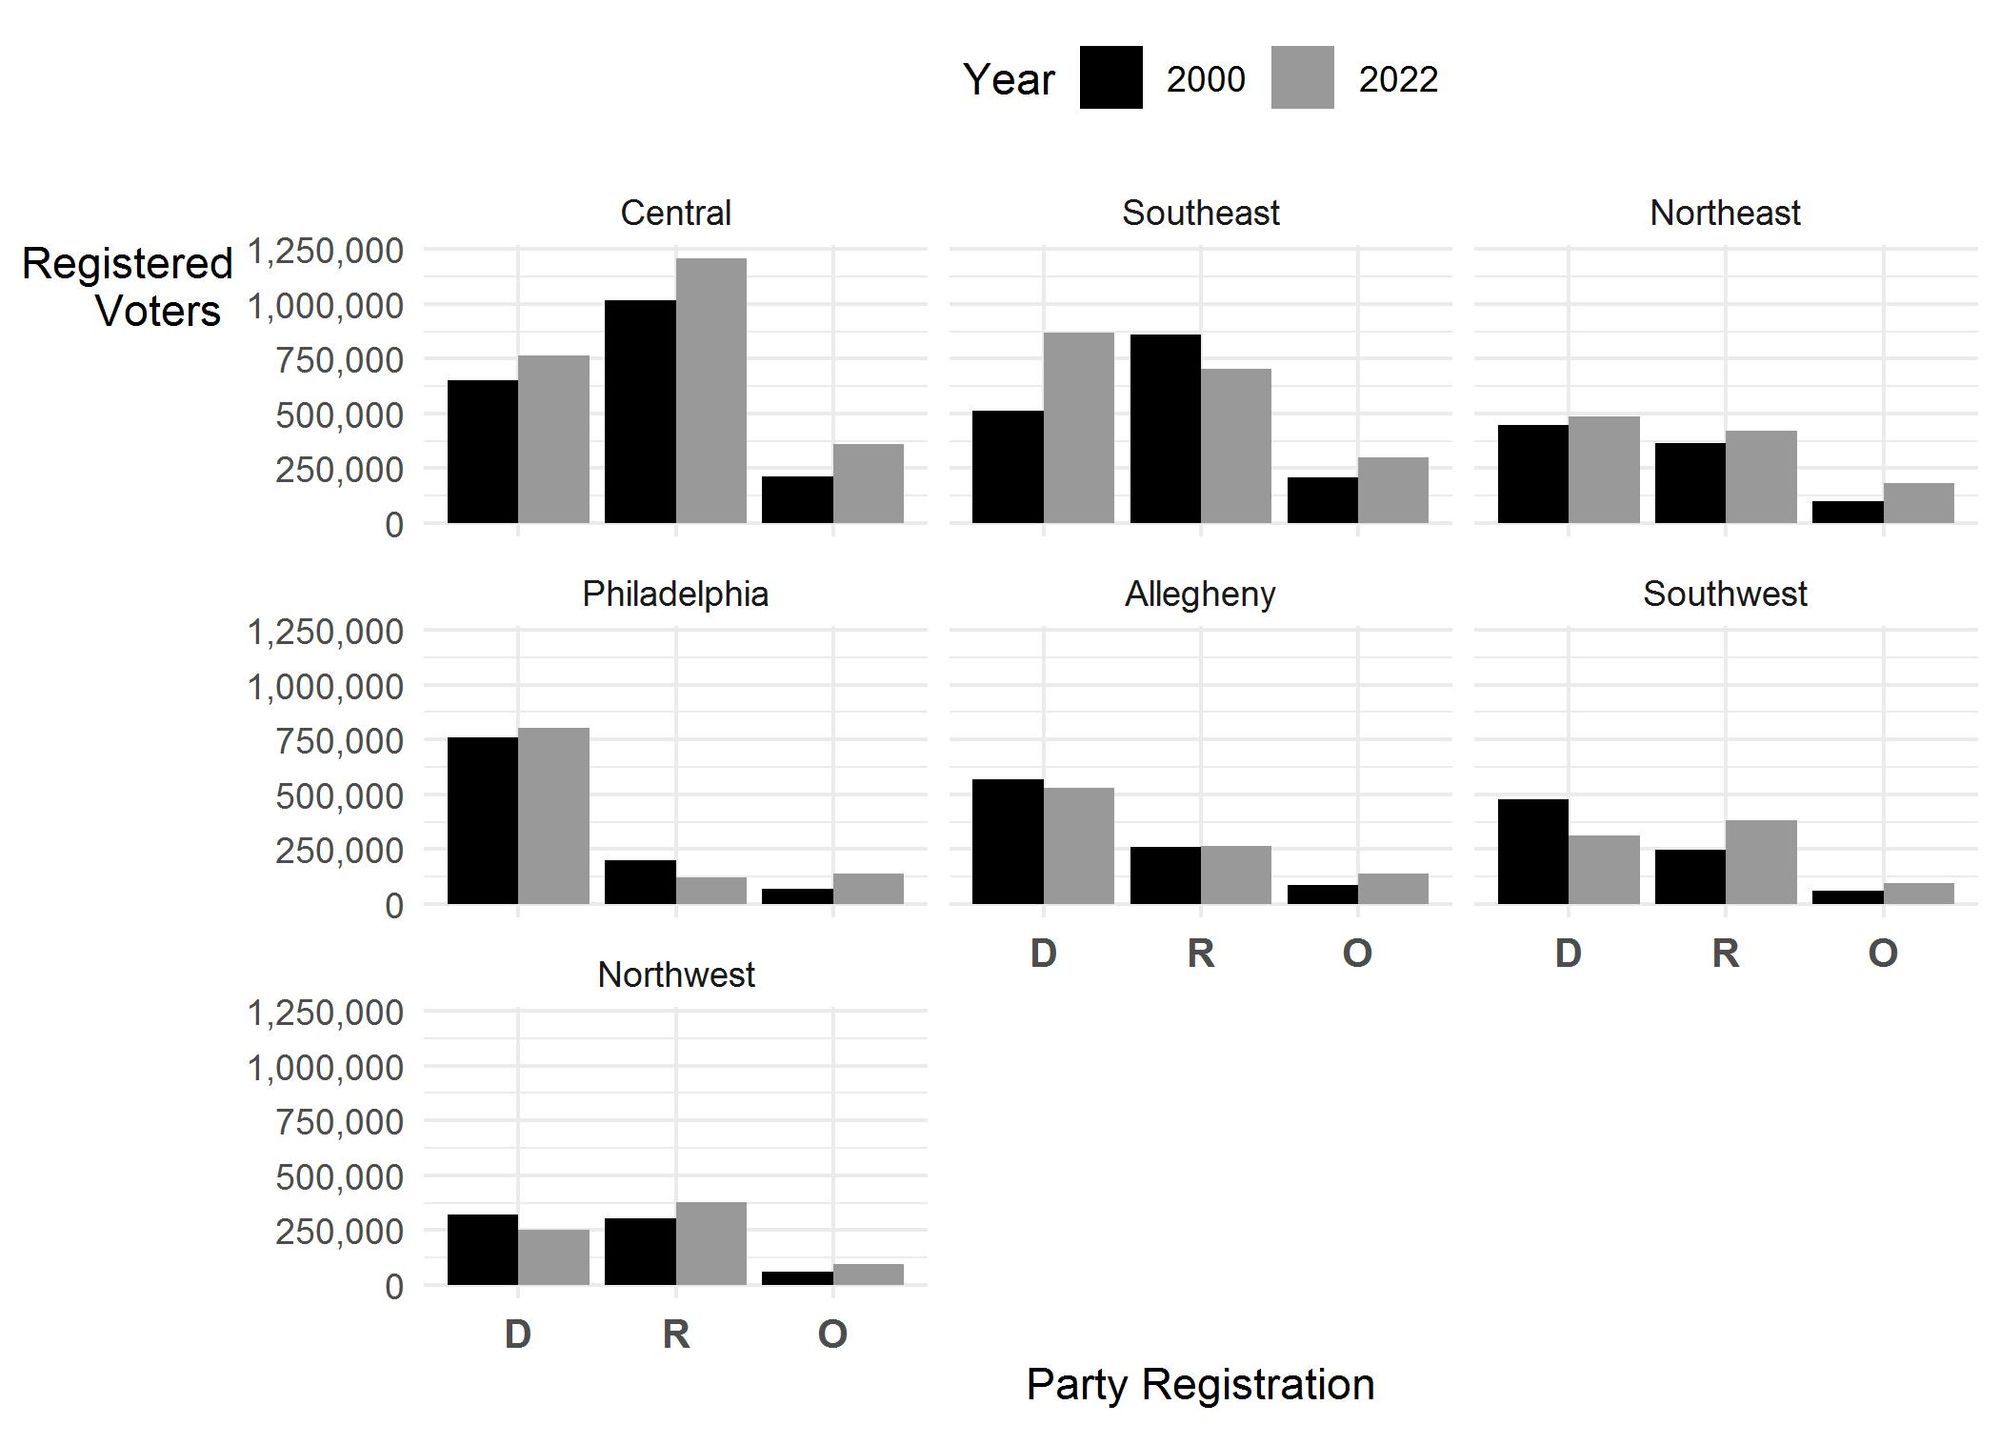
In the aggregate, the state’s voter registration looks about the same in 2022 as it did in 2000. At the time of the November election in 2000, Democrats had a 48.0% to 41.8% registration advantage (6.2 points) that looks almost the same as the 45.6% to 39.5% advantage (6.1 points) it held at the time of the November 2022 midterms.[ii] But those aggregate numbers completely miss the massive realignment of regional registration that has taken place this century, as Figure 1 highlights.
· The Northeast has become more competitive since 2000. While Democrats still hold a slight registration advantage in Northeastern Pennsylvania, their advantage is smaller than it was.
· Democrats have essentially lost western Pennsylvania outside of Pittsburgh. The Northwest had nearly equal partisan registration in 2000, but now Republicans have a nearly 17-point advantage. The Democrats registration in the Southwest has also shrunk from a 29-point advantage to 9-point deficit.
· The Republicans, on the other hand, have lost ground in the Southeast. Republican registration in the Southeast has gone from a 22-point advantage to a 9-point deficit.
· Allegheny County and Philadelphia retain large advantages in Democratic registration, while Central Pennsylvania provides a relatively large registration advantage for Republicans.
· Despite Democrats having a registration advantage, there are a sufficient number of third-party voters in the Northeast and Southeast to make these areas competitive.
While acknowledging that population change and accompanying patterns of regional population and economic growth have also influenced changes to voter registration since 2000, the demographic and social sorting that has taken place within each party should be seen as one of the main propellants for these changes.
Implications
Ideological and regional sorting has changed state politics. Compared to 2000, Republicans should now have an easier time motivating and appealing to their voters given the party’s ideological cohesion. Democrats have a more difficult task in motivating and messaging to their voters since they need to appeal to the moderates who constitute their essential core and to the liberals who provide their energy. But it is these competing constituencies that help keep the state competitive.
In fact, the state’s battleground status exists mostly because of the state’s moderate voters, who remain the state’s single largest ideological group.[iii] An overlooked but consequential change in state voters’ political affiliation has taken place among these moderates—in 2000, two in five (39%) of the state’s moderate voters were registered as Republican, but only one in four (25%) are registered as Republican now.
So the real battleground in our battleground is among the state’s moderate voters, three-quarters of whom are registered Democrats (53%) or Independents (22%). This realignment of moderate voters has likely moved the state from Republican leaning in the 20th century to Democratic leaning in the 21st. Despite Democrats holding a voter registration advantage in the state since the 1970s, Republicans who ran for governor, US Senate, and President won 18 of the 24 (75%) elections held from 1970 through 1999. Since 2000, Republicans have won only six of 20 (30%) top-tier races.
No one can say for sure whether this change will persist, but it is worth watching.
[i] The data for 2000 includes 1,752 respondents from surveys conducted in February (n=600), September (n=602), and October (n=550) 2000. Data for 2022 includes 3,726 respondents from surveys conducted in March (n=490), April (n=785), May (n=792), August (n=522), September (n=517), and October (n=620) 2022. All surveys are of registered voters. Surveys conducted in 2000 were conducted using random-digit-dial telephone surveys while surveys conducted in 2022 were mixed-mode surveys conducted using registration-based sampling procedures. The data is based on self-reported registration, which can differ from party identification.
[ii] County-level voter registration figures come from the Pennsylvania Department of State and represent registration figures of the general election held in each year.
[iii] The state’s voters identified ideologically as liberal (20%), moderate (38%), and conservative (36%) in 2022 compared to liberal (20%), moderate (40%), and conservative (34%) in 2000.
Franklin & Marshall College Poll Newsletter
Join the newsletter to receive the latest updates in your inbox.