
Franklin & Marshall College Poll Release: PA 10th Congressional District, June 2024
In this poll of registered voters in PA CD-10, we look at the mood of the district's voters and explore the state of the 2024 presidential and congressional races, including the effect of the Trump guilty verdict on voters' choices.
Dear Readers,
I'm writing to share our summary report for the June 2024 Franklin & Marshall College Poll of registered voters in Pennsylvania's 10th Congressional District. I've highlighted a few of the key findings below, but I encourage you to read the full report, including cross-tabulation tables for selected questions, which is attached. The Poll explores the mood of the district’s voters, their ratings of local and national political figures, and how those feelings compare to those of voters in the state as a whole.
Thank you for reading,
Berwood Yost
Introduction and Overview
Pennsylvania’s 10th Congressional District is a Republican-leaning congressional district located in south central Pennsylvania, represented by six-term Republican incumbent Scott Perry. Representative Perry won his first few reelection campaigns with relative ease, although his margins have become closer since 2018 when his district became more competitive due to redistricting. He won reelection in 2022 by a 54% to 46% margin over Democrat Shamaine Daniels. Representative Perry served as the leader of the House Freedom Caucus in a prior term and has received significant local media attention for his role in challenging the state’s presidential election results in 2020. While Pennsylvania’s 1st, 7th, and 8th Congressional Districts are expected to be closely contested races, some politicos believe the 10th will be more competitive than usual this year. The following summary highlights the findings of a survey of 397 registered voters who live in Pennsylvania’s 10th Congressional District.
The June 2024 Franklin & Marshall College Poll of registered voters in Pennsylvania’s 10th Congressional District finds that the opinions of voters in this district mirror those of state residents as a whole in their general pessimism, their concerns about the economy, their concerns about their personal finances, and their dissatisfaction with President Biden’s job performance. In fact, voters in the 10th are more critical of President Biden than are the state’s voters as a whole. There are more registered Republicans than Democrats living in PA-10, and the district tends to prefer Republican candidates. For instance, more residents believe the country is “better off” when Republicans control the U.S. House, although these voters also express dissatisfaction with the state of politics at this time.
Both Scott Perry and Donald Trump are leading their respective races in the district, but the announcement of the verdict in Donald Trump’s hush money case, which took place while the survey data was being collected, appears to have reduced each candidate’s support.
Direction of State and Personal Finances
Half (47%) of respondents say they are “worse off” than a year ago, which is similar to how registered voters in Pennsylvania responded during our most recent poll (45%). Most Republicans and conservatives say they are “worse off” than last year, but a quarter of Democrats (25%) and two in five Independents (42%) also said they were “worse off” financially. One in four (25%) registered voters in the 10th Congressional District expects they will be “worse off” financially a year from now. As is true across the state, voters in PA-10 are more pessimistic than optimistic about conditions in the state with about half (49%) reporting the state is “off on the wrong track.” Still, two in five (42%) believe things in the state are “headed in the right direction.”
Concern about the economy (31%), including unemployment and higher gas and utility prices, are mentioned as the most important and often mentioned problem facing the state, according to registered voters in the 10th district. Concerns about government and politicians (16%), taxes (8%) and education (8%) are the next most often expressed problems.
PA-10 Electoral Context
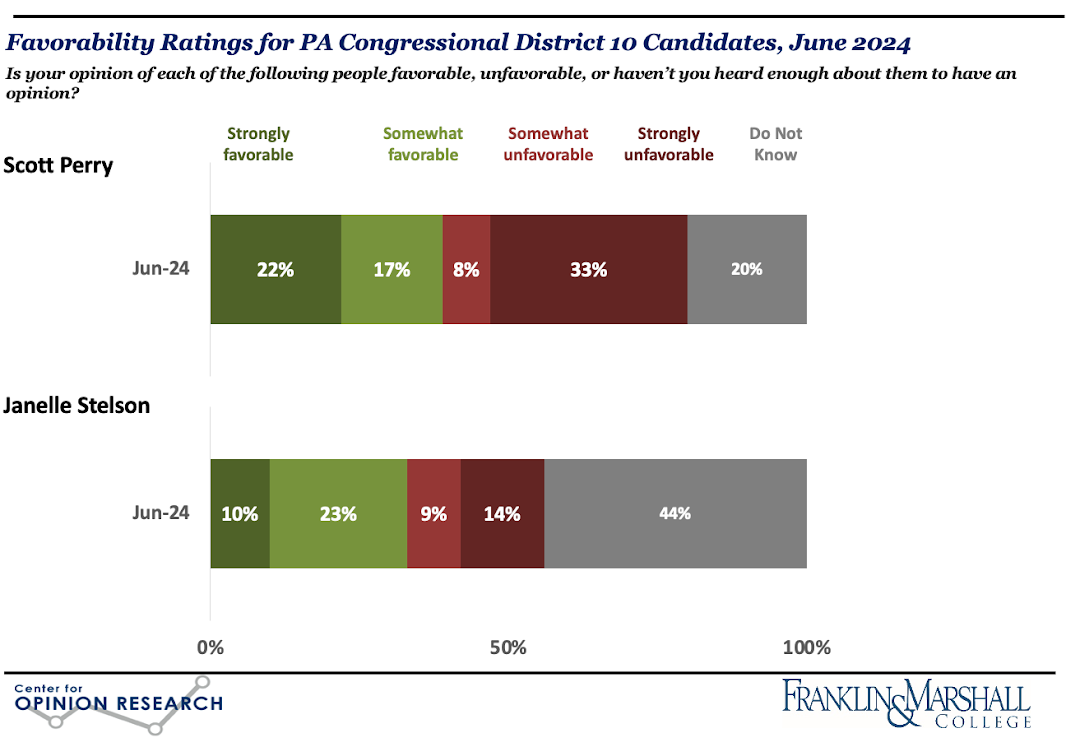
Representative Perry’s job approval ratings are relatively low: only one in three (36%) registered voters believes he is doing an “excellent” or “good” job as their representative. He is rated positively by most Republicans (68%), but his ratings among Democrats (9%) and Independents (17%) are low. Representative Perry’s personal favorability ratings are relatively even, with 39% holding a favorable opinion of him and 41% having an unfavorable opinion (see Figure 1). Democrat Janelle Stelson has a net positive favorability rating among voters in the 10th, with 33% viewing her favorably and 23% viewing her unfavorably, but nearly half (44%) say they don’t know enough about her to have an opinion.
The registered voters in this district are still learning about the candidates. More than a quarter did not know that Congressman Perry voted against certifying Pennsylvania’s 2020 election results (26%) or that he helped create a plan that pressured Vice President Pence to throw out the electoral votes from states won by Joe Biden (29%). Half (50%) are unaware that Janelle Stelson lives outside of the district.
Representative Perry leads Janelle Stelson in a head-to-head matchup, 45% to 44%, with 11% undecided. However, responses to this question may have been affected by the verdict in President Trump’s hush-money case, which was announced in the midst of gathering data for the survey. Table 1 shows that voters’ preferences changed after the verdict with fewer voters expressing support for Perry and more saying they were undecided.
Table 1. Candidate Preferences for U.S. Congress, PA-10, by Interviewing Period
|
Candidate |
Pre-Verdict (n=228) |
Post-Verdict (n=165) |
Total (n=393) |
|
Janelle Stelson (D) |
42% |
47% |
44% |
|
Scott Perry (R) |
49% |
39% |
45% |
|
Don’t Know |
9% |
14% |
11% |
The reasons that voters prefer one candidate to the other are often defined by their feelings about the incumbent. The main category of response for those supporting Stelson is that they are voting against Perry (40%) and the main category of response for those supporting Perry is that they feel positively about him (27%) and that he aligns with their personal views (25%). Many voters who support Stelson see Perry as an extremist and someone who does not represent the values of Pennsylvania. Stelson’s supporters frequently mentioned Perry’s involvement in the January 6th insurrection and attempts to overturn the 2020 election. Stelson’s supporters see her as more moderate, although concern about her lack of experience does appear. Perry’s supporters point to his conservatism, his support for the military, his constituent service, his voting record, and his defense of the Constitution as reasons they support him. The intensity and frequency of comments related to democracy, women's rights, integrity, and representation suggest that these will be among the most important issues to voters in this district.
The Presidential Race in PA-10
One in four (26%) voters in PA-10 believes President Biden is doing an “excellent” or “good” job as president, which is lower than his statewide approval rating in April (35%). President Biden is viewed more unfavorably (62%) than favorably (36%) by the district’s voters, which is also lower than his statewide favorability rating. More voters have an unfavorable (55%) than favorable (42%) opinion of Mr. Trump. Altogether, one in five (18%) voters has an “unfavorable” opinion of both presidential candidates.
Donald Trump leads President Biden in PA-10, 44% to 38%, but these results also showed differences by the date of interviewing (see Table 2). Support for Robert Kennedy increased after the verdict while Trump’s support declined. Mr. Trump beat Joe Biden in PA-10 in the 2020 election, 51.4% to 47.2%.
Table 2. Candidate Preferences for President, PA-10, by Interviewing Period
|
Candidate |
Pre-Verdict (n=225) |
Post-Verdict (n=167) |
Total (n=392) |
|
Donald Trump |
47% |
40% |
44% |
|
Joe Biden |
36% |
40% |
38% |
|
Robert Kennedy |
8% |
13% |
10% |
|
Other |
5% |
4% |
5% |
|
Don’t Know |
4% |
4% |
4% |
Methodology
The survey findings presented in this release are based on the results of interviews conducted May 28 – June 2, 2024. The interviews were conducted at the Center for Opinion Research at Franklin & Marshall College. The data included in this release represent the responses of 397 registered Pennsylvania voters who live in the 10th Congressional District, including 151 Democrats, 175 Republicans, and 71 Independents. The sample of voters was obtained from Aristotle. All sampled respondents were notified by mail about the survey. Interviews were completed over the phone and online depending on each respondent’s preference. Survey results were weighted (age, gender, education, geography, vote history, and party registration) using an iterative weighting algorithm to reflect the known distribution of those characteristics. Estimates for age, geography, and party registration are based on active voters within the Pennsylvania Department of State’s voter registration data.
The sample error for this survey is +/- 6.1 percentage points when the design effects from weighting are considered. In addition to sampling error, this poll is also subject to other sources of non-sampling error. Generally speaking, two sources of error concern researchers most. Non-response bias is created when selected participants either choose not to participate in the survey or are unavailable for interviewing. Response errors are the product of the question and answer process. Surveys that rely on self-reported behaviors and attitudes are susceptible to biases related to the way respondents process and respond to survey questions.
Franklin & Marshall College Poll Newsletter
Join the newsletter to receive the latest updates in your inbox.