

2026 Midterm Multipliers: Drivers of the Historic Blue Wave
Democrats over-performed predictions across the United States. What did pollsters and pundits miss?
Dear Readers,
Today’s newsletter is the first of several I expect to write about the 2026 midterm elections. I suggest three inter-connected dynamics that led to the Democrats’ over-performance across the country, and also touch briefly on how our polls performed. I hope you find the analysis interesting and useful.
Thank you for reading,
Berwood Yost
Pollsters and Pundits Saw the Blue Wave Coming, but Missed its Scale
The massive Democratic victories across the country in the 2026 midterm elections largely reflected what polling showed as Election Day approached. Voters were deeply unhappy with their economic circumstances and with the effects that the Trump Administration’s policies were having on their own lives. In addition, many of the Administration’s policy positions were not popular with voters. As a consequence, voters rated the president’s performance poorly and Republican officeholders suffered.
The breadth of down ballot wins emerged from these circumstances. Wave elections affect down ballot races because the voters in those districts are swept up in the broader sentiment that everyone is feeling. In a normal year, elections turn mostly on the characteristics of the district and the candidates that are running, but in a wave year those local features matter much less and the broader circumstances take their place. This broader sentiment also drives decisions about who votes and who doesn’t.
While the polls did a good job of describing the political mood and predicted that Republicans were likely to suffer some losses, the size of Republican losses was significantly understated. Not only did many polls understate the Democrats’ expected performance, so did the seat prediction models produced by political scientists. Relying on inputs that include the state of the economy, economic growth, presidential approval, and expert judgments, among other factors, the political science forecasts largely understated the number of seats that Democrats would win in the US House (avg = 244 Democratic seats) and US Senate (avg = 51.5 Democratic seats). What did the polls and non-poll-based election forecasts miss that can explain the Democrats’ wildly successful midterm?
Three Multipliers that Explain the Miss: Corruption, Messaging, and Monoculture
Corruption could be one of those compounding factors. Corruption immediately comes to mind as a catalyzing force considering the Democrats’ nearly 17-point advantage in the Congressional vote share in 1974, similar to the 14-point advantage they had this year. The 1974 wave election took place in the aftermath of Nixon’s resignation due to the Watergate scandal, making abuse of power and corruption key themes in those races. This year, exit surveys showed that most voters were concerned about corruption, and it is easy to imagine that the widespread concern voters had about their personal economic circumstance were amplified by the belief that others are unfairly benefitting from government largesse or graft.
Republicans’ final messaging could have also played a role in the magnified results. The final messages expressed by many Republican candidates focused on cultural wedge issues and scare tactics that presented socialism, transgender issues, and public safety as urgent problems. This focus might have felt tone deaf to the large share of voters who were concerned about their economic fortunes. The general unpopularity of the One Big Beautiful Bill Act gave Republicans little to talk about on the campaign trail, and reporting about the bill’s noticeable effects on food and health-related programs made such issues paramount. Undoubtedly, some voters believed that Republican candidates were failing to take their economic precarity seriously, which could have further compounded the Democrats’ advantages on economic issues.
The final and perhaps most likely multiplier may have been the Republican monoculture. In farming, a monoculture is produced by planting a single crop over a large expanse of land. In politics it is seen when a party enforces a single set of cultural norms, identities, and touchstones. Republican officeholders and candidates have increasingly mimicked the president’s image since he began reshaping the party after his 2016 victory, a process that only sped up after his 2024 re-election. Trump’s pruning and reassembling of the Republican’s electoral offerings allowed almost no daylight between the president’s policies and beliefs and the images of those running for election. Republicans had no room to run on their own brands in ways that fit their strengths and that matched their constituents’ particular needs and interests. By relentlessly pruning the party tree, the President created a group of candidates who lacked the diversity they needed to adapt and survive.
The Republican’s movement toward a single character type was further driven by a zealous belief that their positions were preferred by voters. Kevin Roberts, the President of the Heritage Foundation has said, “I think that this prognosticating is a psyop by so many of these polling firms in order to do what, to depress conservative turnout.” This sentiment was echoed by House Speaker Mike Johnson when he discounted the tight polling in Pennsylvania’s 10th Congressional District: “All the pollsters are wrong. Let me tell you what’s happening: they’re under sampling Republicans. We know it to be true.”
Any crash of the magnitude the Republicans just experienced is created by a systemic failure. The Republican monoculture and their belief in a false consensus about their policies created the conditions that led to that failure. There is a lesson for both parties in that fact.
The Polling: Mostly on the Mark in Pennsylvania
This year’s Franklin & Marshall College polling documented a clear picture about the decisive issues and motivations driving voters. It also produced some specific estimates about the election that were incredibly accurate. The final F&M Poll in October suggested turnout among Pennsylvania registered voters would be 55%—and at the moment the turnout among registered voters is 55.1%. It predicted Shapiro would win by 23 points—and his current margin of victory is 22.2 points. Finally, it suggested the Democrats would win the state’s congressional vote by 14 points—and that vote currently stands at a 13.4 point Democratic advantage. This isn’t a one-off; the average miss in our likely voter estimates for US House and other offices since 2022 has been about 2 points.
The Real Clear Politics polling average for the governor’s race was 26 points, so the polls were collectively on the mark in Pennsylvania. The New York Times Pennsylvania congressional polls, which received a tremendous amount of attention, were surprisingly off the mark. Their congressional polls on average understated the Democratic vote share by more than 5 points (Table 1). The Times uses high quality methods, but they struggled in these races and that struggle was magnified by their choice to emphasize the horse-races instead of the electoral context.
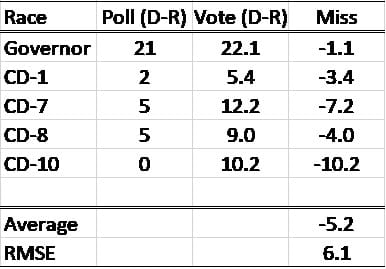
I plan to conduct a fuller assessment of Pennsylvania's election polling in future posts. In addition, upcoming newsletters will dive into county-level changes in voting between 2024 and 2026 and how those changes fit the broader patterns we've seen this century, and how Governor Shapiro's electoral performance fits into the patterns we traditionally see for incumbent governors.
Franklin & Marshall College Poll Newsletter
Join the newsletter to receive the latest updates in your inbox.