
Franklin & Marshall Poll Release: October 2025
The first poll since the 2024 election explores a number of issues, including AI, democracy, and the state Supreme Court retention election, along with the mood of Pennsylvania's voters and their ratings of President Trump and Governor Shapiro.
Dear Readers,
I’m writing to share our summary report for the October 2025 Franklin & Marshall College Poll. I've highlighted a few of the key findings below, but I encourage you to read the full report, which is also included. The full report includes cross-tab tables as attachments for five key questions, including assessments of personal financial well-being and the job approval ratings for Governor Shapiro and President Trump. The Poll explores the mood of the state’s voters and their positions on a number of contemporary issues--including Artificial Intelligence, democracy, and the separation of powers—in addition to their ratings of state political figures and the state Supreme Court retention election.
Thank you for reading,
Berwood Yost
Key Findings
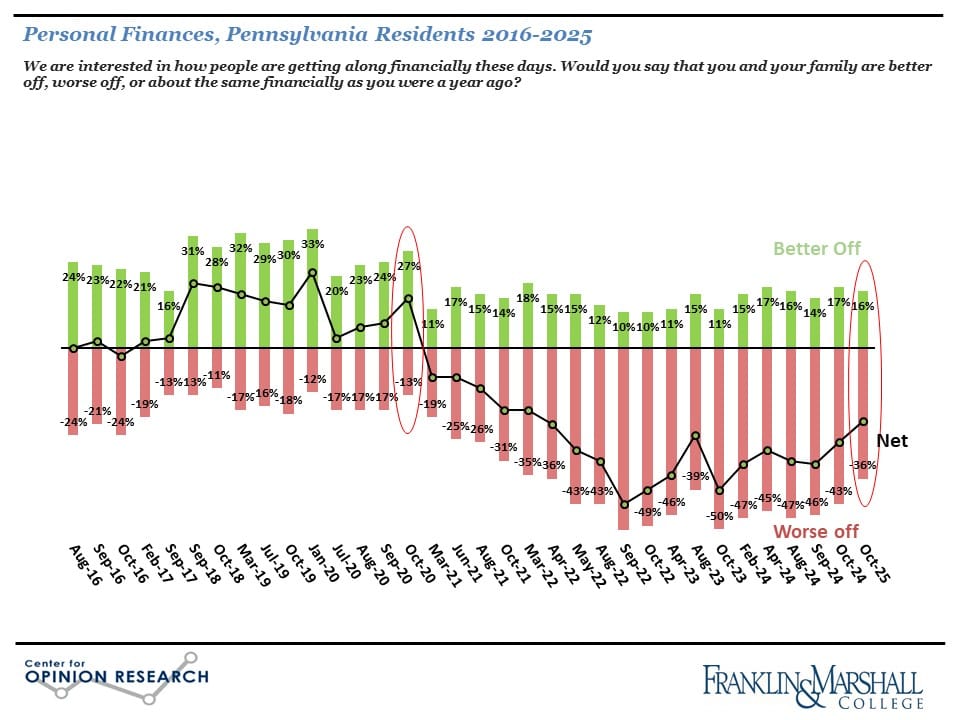
The October 2025 Franklin & Marshall College Poll finds that more registered voters believe the state is “on the wrong track” (46%) than believe it is “headed in the right direction” (37%). The last time a majority of registered voters believed the state was headed in the right direction was January 2020. Nearly two in five (36%) respondents say they are “worse off” financially than a year ago, and only 16% say they are “better off.” The share of voters who say they are “worse off” is at its lowest point since April 2022, but negative sentiments about personal finances are consistent with the economic concerns respondents have expressed over the past several years (Figure 1). Despite these financial concerns, voters report the economy (22%), including unemployment, housing and real estate costs, and higher gas and utility prices, as only the second most important problem facing the state. Concern about government and politics (23%) is mentioned more often than the economy as the state’s most important problem.
State Politics
The concerns registered voters have about the direction of the state and their own personal finances have not yet harmed Governor Shapiro’s job approval ratings. More voters believe he is doing an “excellent” or “good” job (51%) as governor than believe he is doing a “fair” or “poor” job (40%). Three in four Democrats, half of independents, and just over a quarter of Republicans rate the governor’s performance as “excellent” or “good.”
State Supreme Court Retention Elections
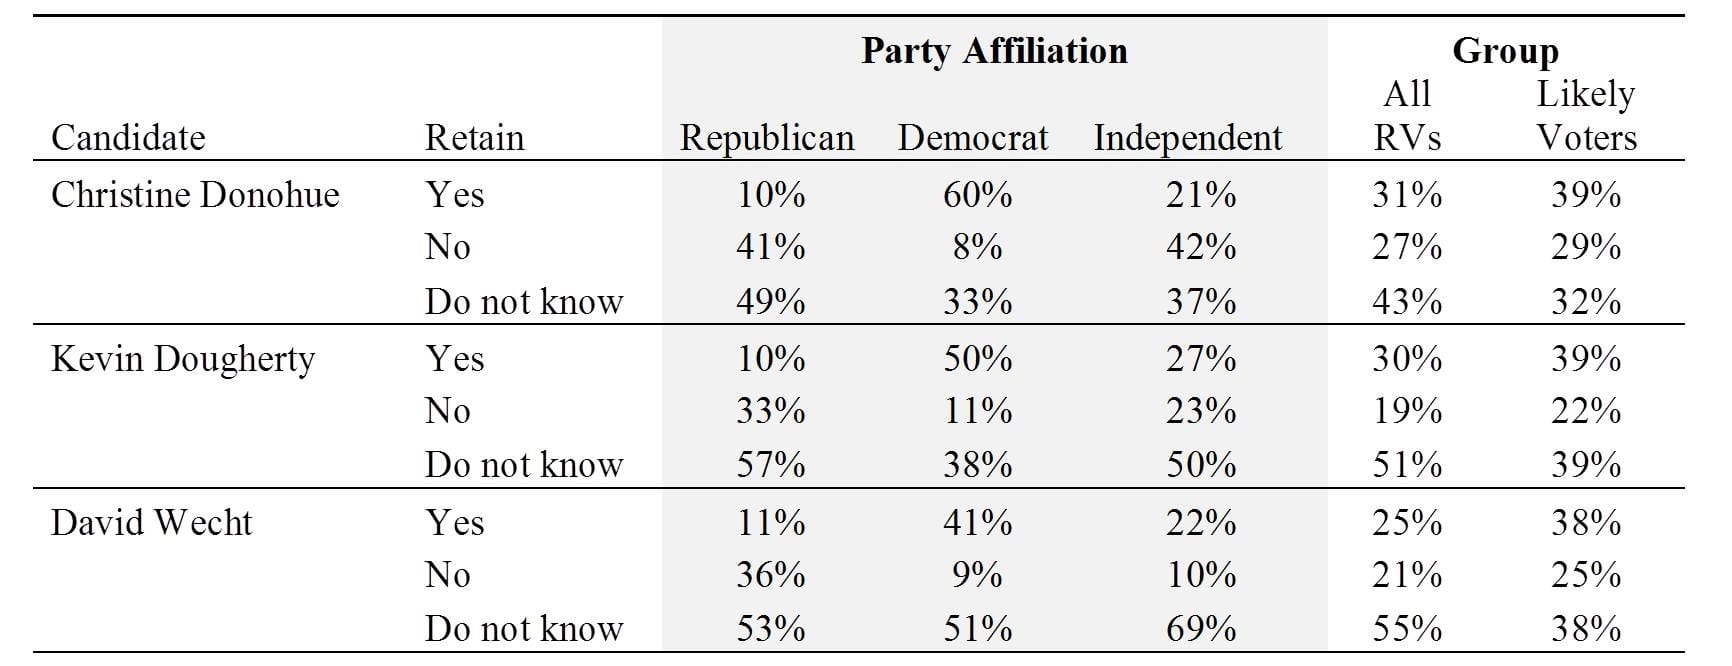
The retention election of three state Supreme Court justices has had more media attention and campaign expenditures than usual for such races, and the outcomes of those races are unpredictable at this point. This unpredictability is because roughly half of voters are undecided about their preferences, there are strong partisan differences driving the retention decision, and even likely voters are undecided about how they will vote (Table 1). Whatever else might be said about these races, the campaigning so far has injected more partisanship than is typical into the retention decision.
Table 1. Supreme Court Retention Preference by Party Affiliation and Likelihood of Voting, Pennsylvania, October 2025
Presidential Ratings
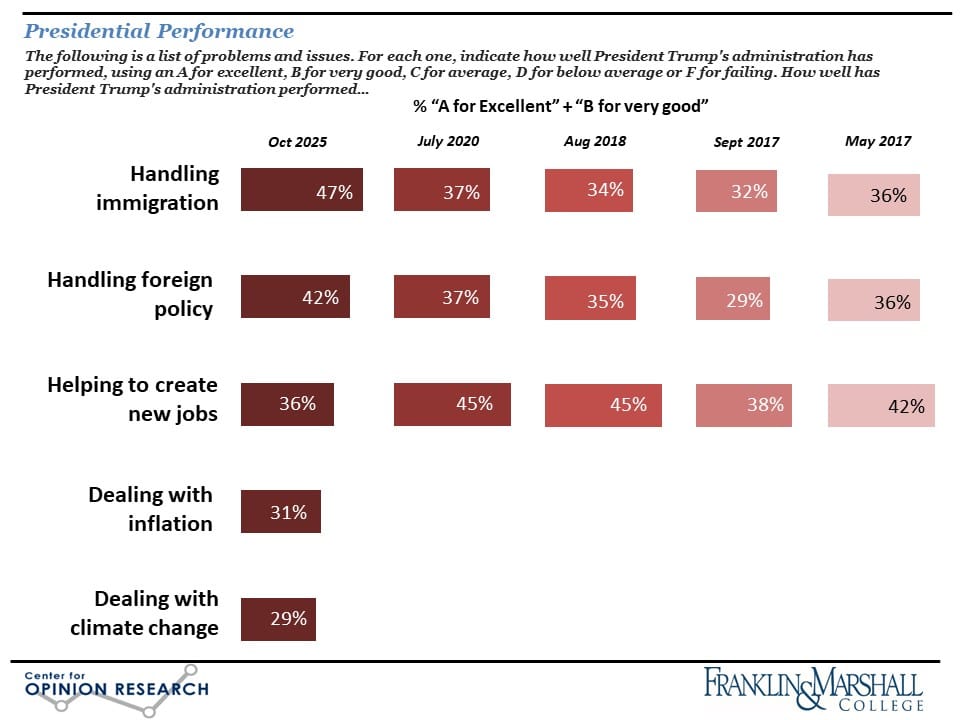
Fewer voters believe President Trump is doing an “excellent” or “good” job (41%) as president than believe he is doing a “fair” or “poor” job (58%), but his ratings are comparable to his job approval ratings in Pennsylvania at the time of the 2020 election. President Trump’s approval ratings are similar to Barack Obama’s at this point in his second term, and are higher than George Bush’s job approval ratings in Pennsylvania at the same point in his presidency. The president’s approval ratings for specific policy actions are similar to his overall ratings, although the state’s registered voters are more satisfied with the administration’s performance in some areas than others (Figure 2). The Trump administration gets its highest ratings for the way it is dealing with immigration, but the administration’s performance on taming inflation is its greatest liability at the moment. The administration’s tax and budget bill, the One Big Beautiful Bill Act, is perceived negatively by the state’s voters—more of the state’s registered voters oppose (51%) than favor (40%) the bill.
Contemporary Issues: AI, Democracy, and Separation of Powers
Most registered voters in the state “rarely” (24%) or “never” (35%) use artificial intelligence (AI) tools in their daily lives, but most (71%) are “nervous” about advancements in AI. Nearly four in five (79%) believe AI should be more closely regulated by the federal government, a sentiment shared by large majorities of voters in each party.
Voters are more dissatisfied (64%) than satisfied (35%) with the way American democracy is working today, although large majorities of Pennsylvania voters are committed to specific democratic principles. Three in five registered voters believe that Congress (60%) and the courts (56%) have ceded too much of their authority to the presidency, although partisanship drives these perceptions.
Methodology
The survey findings presented in this release are based on the results of interviews conducted September 24 – October 5, 2025. The interviews were conducted at the Center for Opinion Research at Franklin & Marshall College. The data included in this release represent the responses of 929 registered Pennsylvania voters, including 399 Democrats, 390 Republicans, and 140 independents.[1] The sample of voters was obtained from Aristotle. All sampled respondents were notified by mail about the survey. Interviews were completed over the phone and online depending on each respondent’s preference. Survey results were weighted (age, gender, education, geography, vote history, and party registration) using an iterative weighting algorithm to reflect the known distribution of those characteristics. Estimates for age, geography, and party registration are based on active voters within the Pennsylvania Department of State’s voter registration data. Gender and education are estimated using data from the November 2022 CPS Voter Registration Supplement.
The sample error for this survey is +/- 4.0 percentage points when the design effects from weighting are considered. In addition to sampling error, this poll is also subject to other sources of non-sampling error. Generally speaking, two sources of error concern researchers most. Non-response bias is created when selected participants either choose not to participate in the survey or are unavailable for interviewing. Response errors are the product of the question and answer process. Surveys that rely on self-reported behaviors and attitudes are susceptible to biases related to the way respondents process and respond to survey questions.
NOTES
[1] The data reported here is voter REGISTRATION and is consistent with past reporting practices. The survey also asked about self-reported voter IDENTIFICATION, which shows a slightly different partisan split: 47% identify as Republican (n=400), 9% as independent (n=74), 42% as Democrat (n=357), and the balance not offering a response. Partisan comparisons in this summary show self-reported registration.
ATTACHMENTS
Franklin & Marshall College Poll Newsletter
Join the newsletter to receive the latest updates in your inbox.