
A Tough Day for Republicans: Pennsylvania’s 2025 Municipal Election
Democrats increased their vote share across the country in the off-year elections, winning in many places where Trump was ahead a year ago. What happened? And what does this mean for the 2026 midterms?
Significant Gains for Democrats
Democratic candidates were the clear winners of the 2025 elections. Up and down the ballot and across the country Democrats won sizable victories and did much better in county after county than they did in 2024. Besides retaining three justices on the State Supreme Court in Pennsylvania, Democrats also won two other statewide judicial races and flipped seats from county officers to local school boards.
Overall, the Democratic candidates for Superior Court in the state performed 7 points better, on average, at the county level than Kamala Harris did in 2024, and the “yes” votes for retaining the Democratic Supreme Court justices were on average 15 points better. Figure 1 compares county-level Democratic vote share for Kamala Harris in 2024 with the vote share for State Superior Court candidate Brandon Neuman in 2025.[1] The right side of Figure 1 plots those counties that had smaller declines in turnout from 2024 to 2025, and the left side shows those counties with larger declines in turnout. Dots above the diagonal line mean that the county vote share for Democrats increased in 2025 and, remarkably, every county increased its support for Democrats.
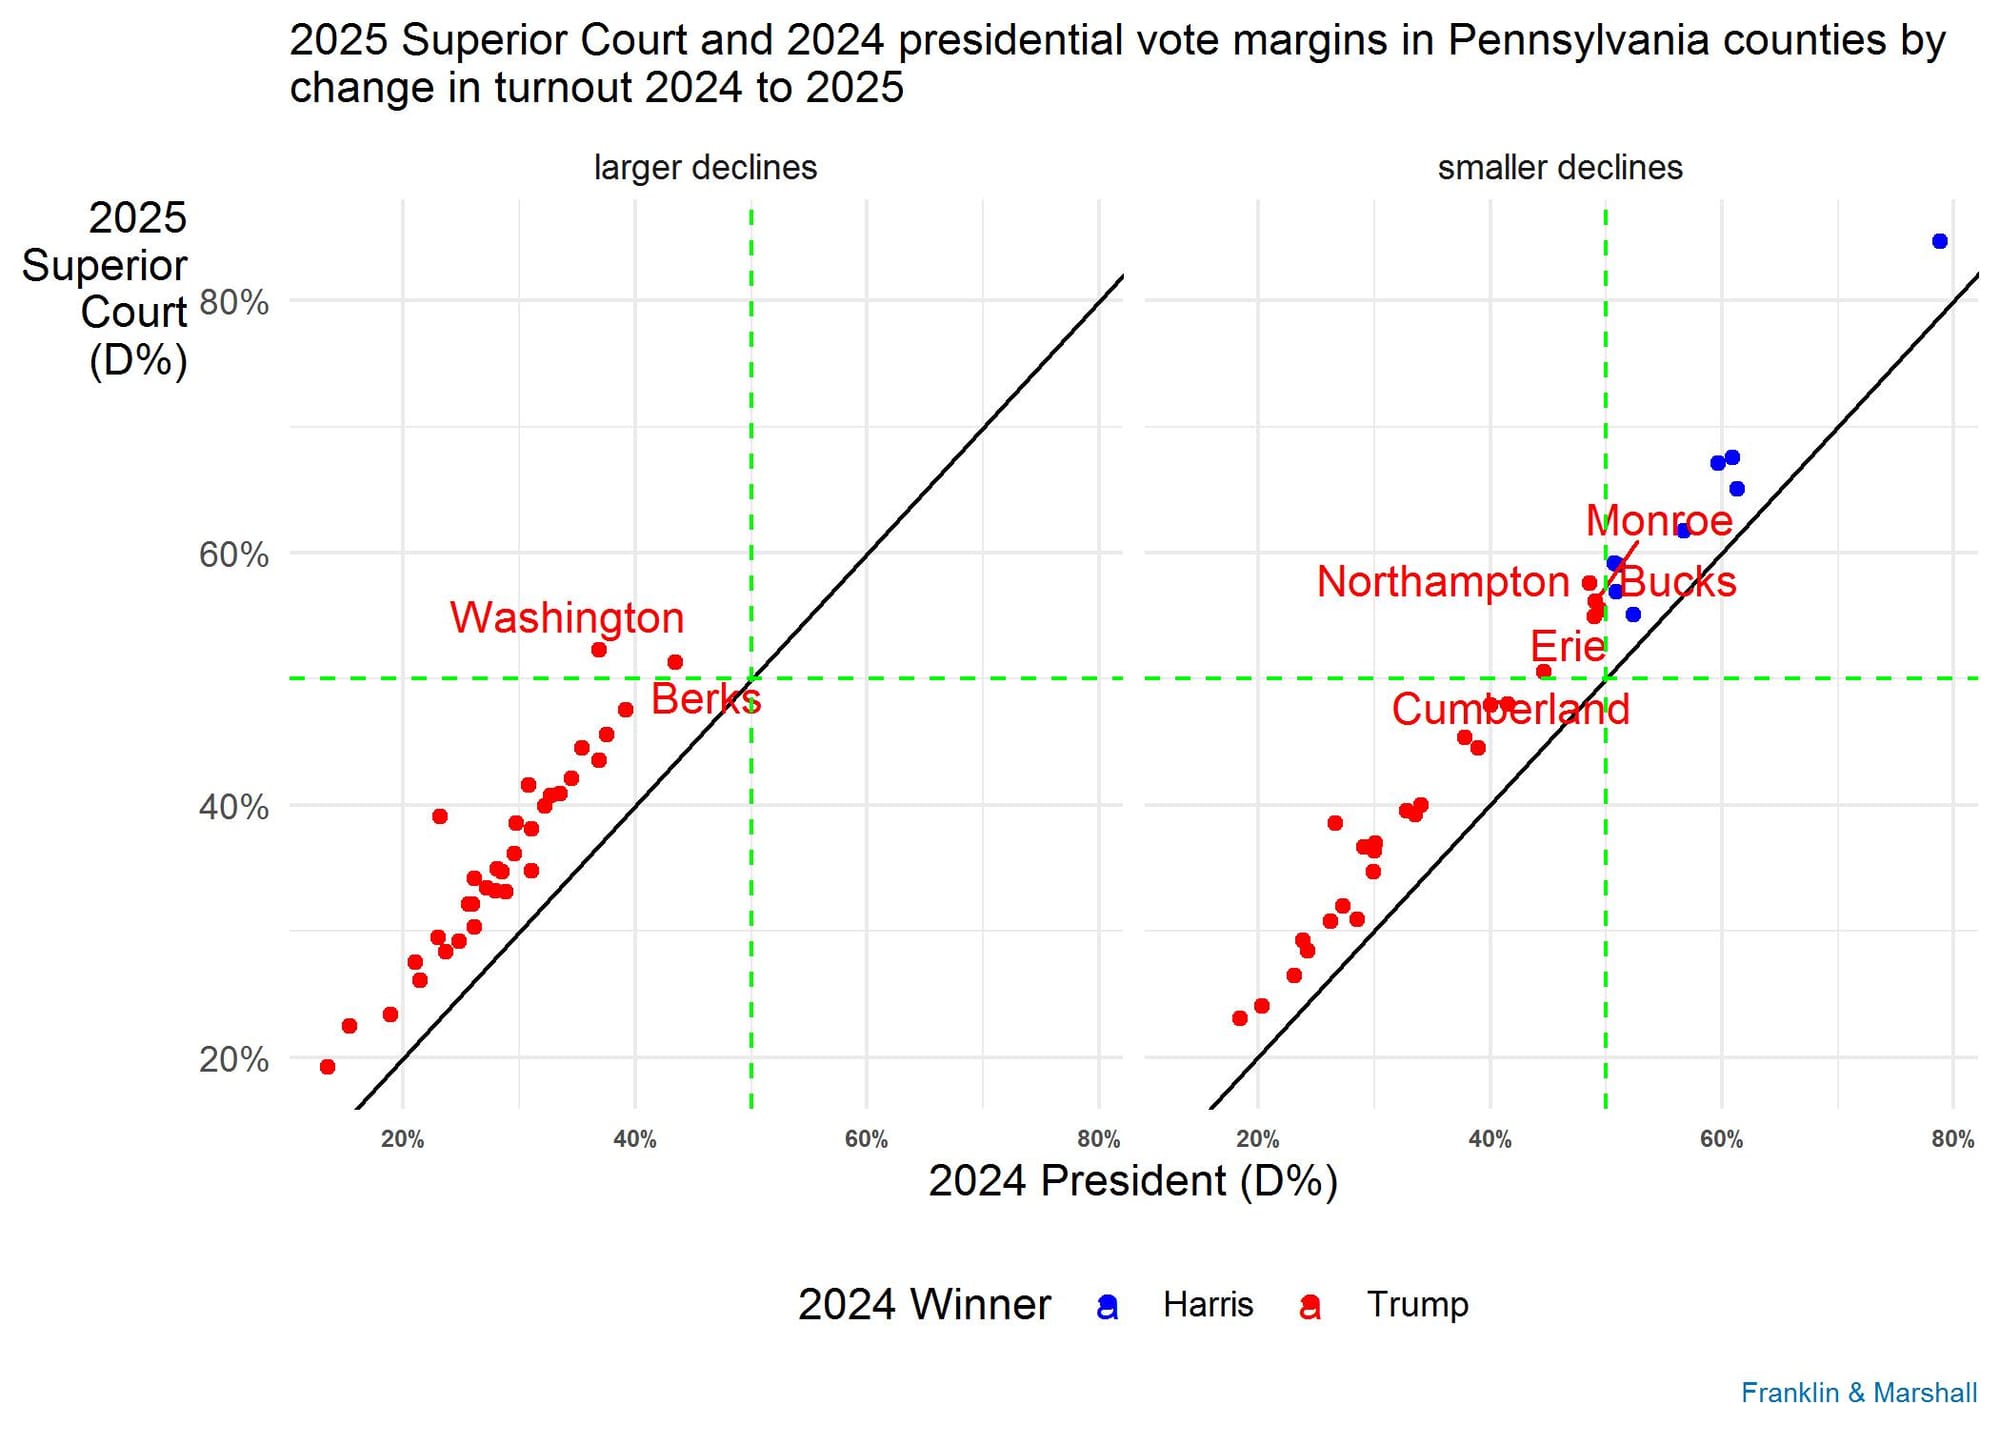
Figure 1 also labels those counties that Donald Trump won in 2024 and that Neuman won in 2025. The most competitive, bellwether counties in Pennsylvania - Bucks, Erie, Monroe, and Northampton - each flipped. Less expected flips happened in three counties - Berks, Cumberland, and Washington - that Trump won easily in 2024. Trump carried Berks County by 12 points and Washington County by 26 points in 2024! These counties’ returns show how high the tide ran toward Democrats in this election, and they also suggest how changes in turnout from 2024 factored into these outcomes.
Voter Turnout: Another Advantage for Democrats
Turnout was far above average for an odd-year election - approaching 41%. Table 1 shows the number of votes cast for the highest vote winner in the last five odd-year elections. In comparison, mid-term elections have averaged about 50% turnout among registered voters since 2000, and this year’s turnout came close to matching the 42% turnout in the 2014 mid-term.
Table 1. Registered Voter Turnout in Recent Pennsylvania Municipal Elections
|
Year |
Votes Cast |
Registered Voters |
Turnout Among Registered Voters |
|
2025 |
3638825 |
8905105 |
40.9% |
|
2023 |
3087058 |
8661186 |
35.6% |
|
2021 |
2769282 |
8676127 |
31.9% |
|
2019 |
2014803 |
8549062 |
23.6% |
|
2017 |
2086001 |
8435015 |
24.7% |
But turnout was uneven across the state, and Democrats benefited from changes in county-level turnout in two ways. First, the counties that Kamala Harris won in 2024 had smaller turnout declines compared to 2024 (about 33 points lower) than did counties that Trump won (about 40 points lower). Second, counties that had larger turnout declines compared to 2025 gave the Democratic Superior Court candidate a larger share of their vote than did those counties with a smaller relative turnout change. Every county that had larger declines in turnout had supported President Trump in 2024. All of this reinforces the suspicion that some 2024 Trump voters did not vote.
Expectations for 2026
Most observers thought the political climate would give Democrats an advantage this year, but few people anticipated the depth of the Democrats’ successes. The political climate in this election cycle was defined by President Trump’s sinking job approval ratings, especially on the economy, by voters’ feelings that the county was headed in the wrong direction, and by the large share of voters who were concerned about their personal finances and increasing prices. These same factors - dissatisfaction with the party in charge and concerns about the state of the country and economy - defined the 2024 election and deeply harmed Democrats, a reminder of how quickly political fortunes can change.
Whether the 2025 election results will mean anything for the 2026 mid-terms is uncertain. In 2023 a Democrat won a Supreme Court race in Pennsylvania and that outcome held little meaning for 2024. Republicans have plenty of time to calibrate their policies and messaging and win back some of the voters they failed to persuade or turn out this time around. Democrats today are feeling much better about their brand and their messaging than they did in the aftermath of the 2024 election. This leaves two inter-related questions that will define 2026: 1) how much momentum and message discipline can Democrats carry into the coming year, and 2) how much can Republicans remake the political climate?
[1] I use the State Superior Court race to compare to 2024 for two reasons. First, this race listed each candidate’s partisan affiliation on the ballot, so it was a true partisan election unlike the retention races that were also on the ballot. Second, the Superior Court race had the largest number of votes cast for any partisan election contest. The data used in this analysis was unofficial (downloaded on 11/10/2025 at 10 am) and could change once the official vote is certified.
Franklin & Marshall College Poll Newsletter
Join the newsletter to receive the latest updates in your inbox.