
The One Big Beautiful Bill: Help or Hindrance to Republicans?
Although it cuts taxes, the One Big Beautiful Bill also significantly reduces Medicaid and SNAP benefits. Will this help or hurt Republicans in the 2026 midterms in Pennsylvania?
The electoral consequences of the One Big Beautiful Bill Act (OBBA) have been and will be a central topic of political news and speculation until the 2026 midterms, and we can expect both parties to peddle their preferred story about the bill in the hopes of gaining some electoral advantage. The competing arguments will shape whether more people view this as a tax cut bill and be pleased by the sizable cuts included, or if more will see it as a bill that reduces benefits and be angered by sizable reductions in Medicaid and food aid.
There seems little doubt, according to the CBO’s assessment, that households in the lowest income categories will be worse off because of reduced benefits provided through Medicaid (MA) and the Supplemental Nutrition Assistance Program (SNAP) included in the bill. Many pundits have wondered why the Republicans would risk the recent gains they’ve made with working class voters by gutting programs those voters rely on. In this newsletter I present some county-level data that can help us understand how voters may respond to these cuts, and whether Republicans are likely to suffer election losses as a result.
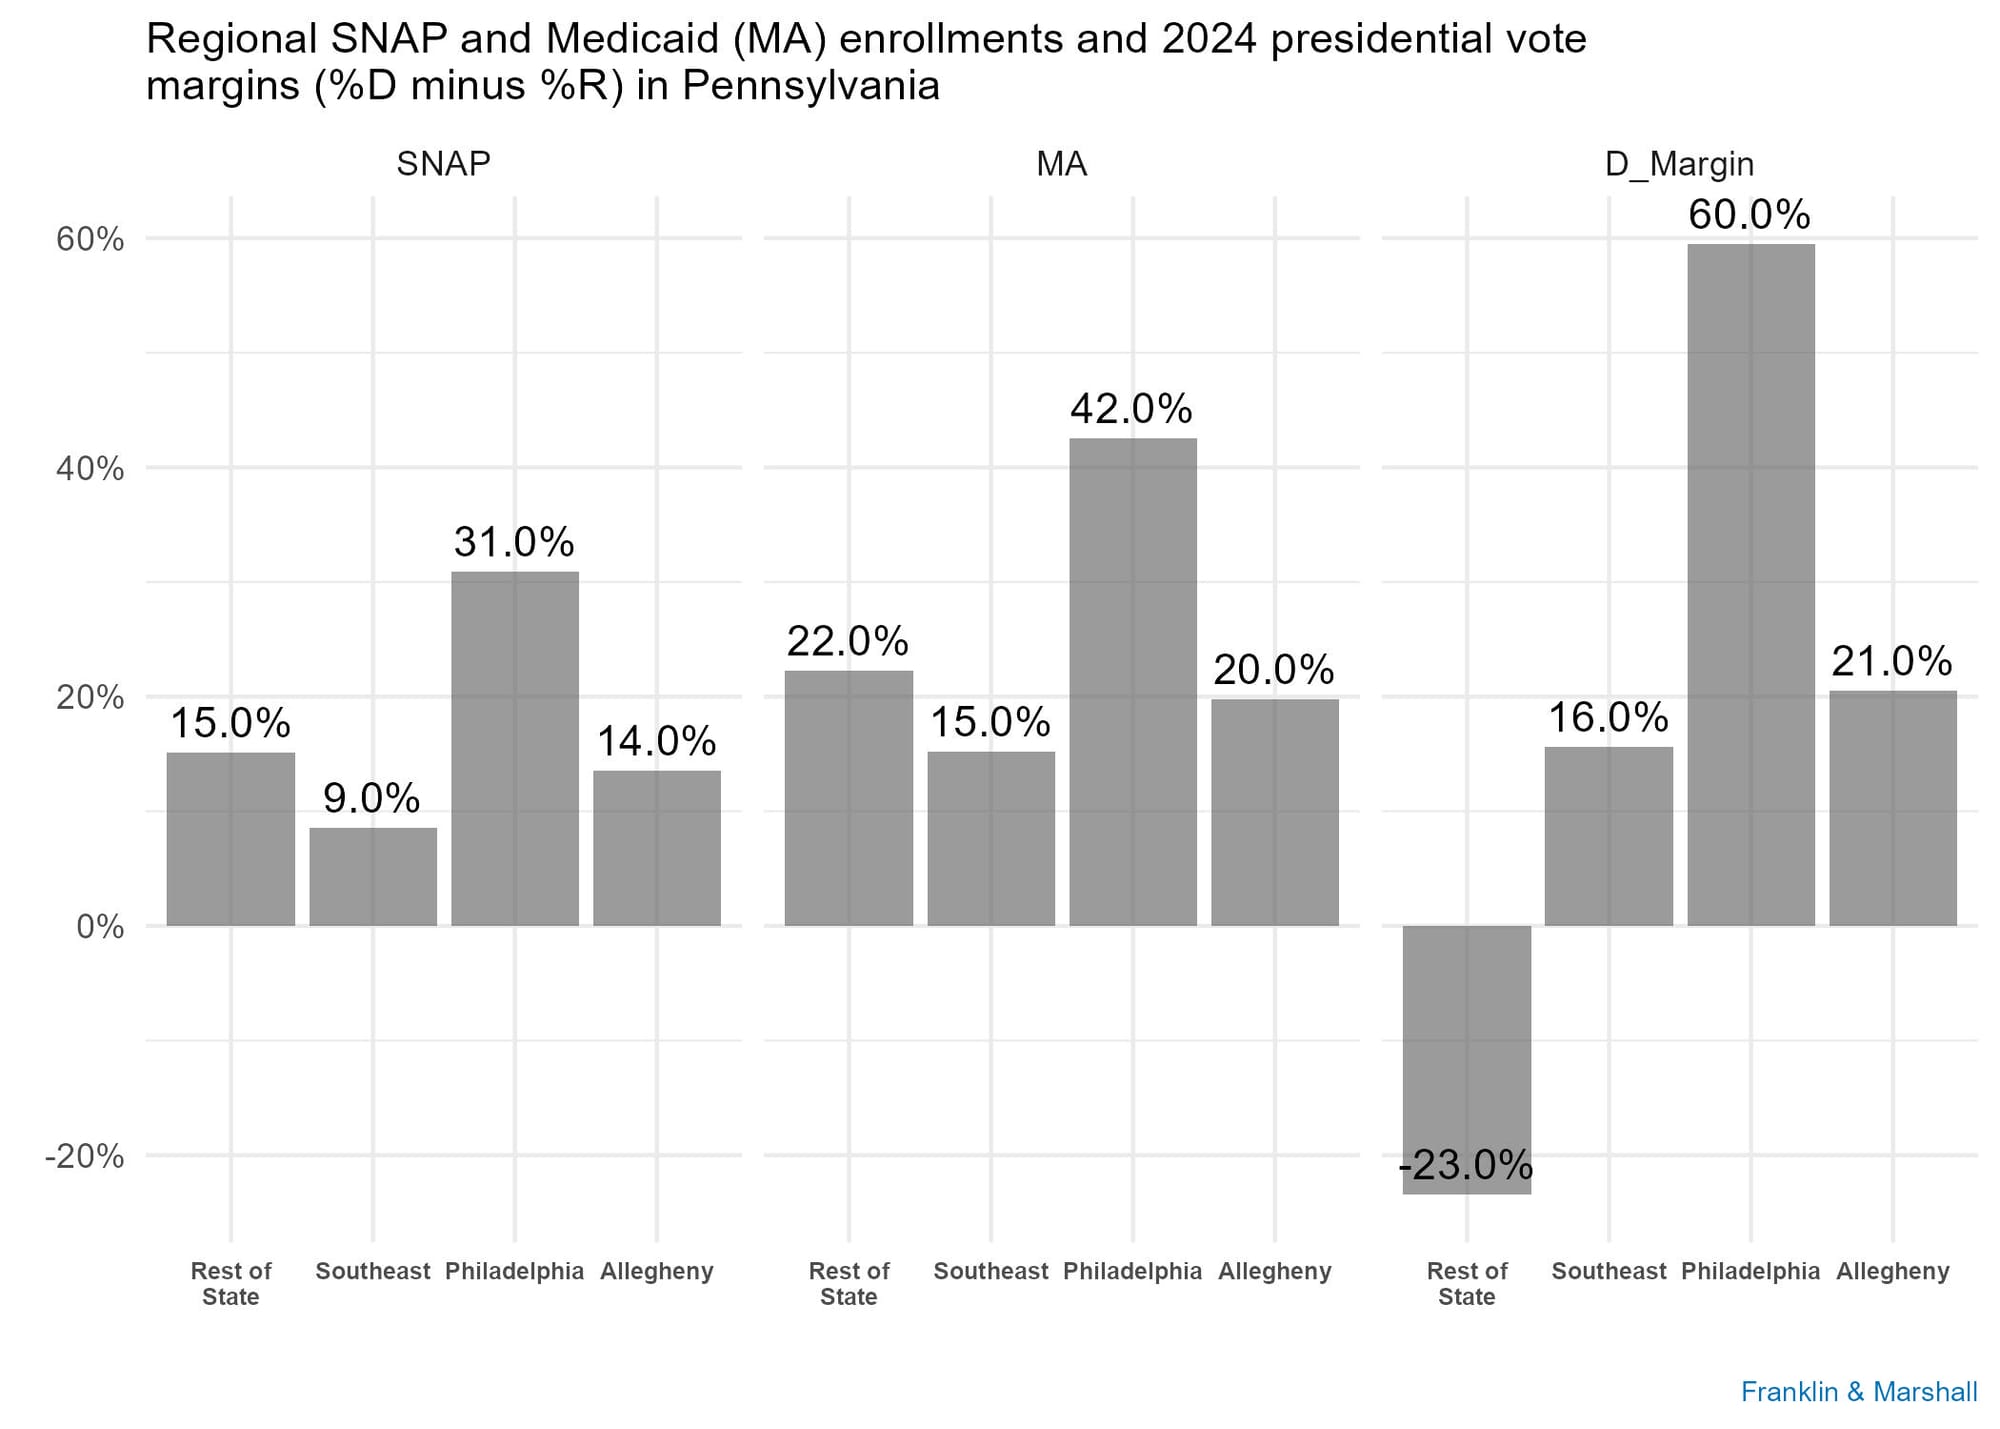
SNAP and Medicaid Enrollment by County [i]
The counties in the state that Republicans count on for a large share of their votes are second only to Philadelphia in the proportion of residents currently enrolled in either SNAP or Medicaid programs (Figure 1). Electorally, Republican candidates win by running up their margins in rural and suburban areas to offset the advantages that Democrats have in the six larger, more urban counties that represent the Democratic base. In 2024, President Trump carried these 61 counties by about 23 points. About one in seven (15%) residents in these counties relied on food assistance (SNAP) and nearly one in four (22%) relied on Medicaid in 2024.
County-level vote margins in the 2024 presidential election were unrelated to the share of residents in a county enrolled in these programs.[ii] These programs were not top-of-mind to voters in 2024, probably because economic concerns were, and because candidate Trump promised no cuts to popular social programs. Threatening these programs is clearly a risk for Republicans since so many people who live in areas that support Republican candidates are enrolled in them. But that explanation is by itself incomplete.
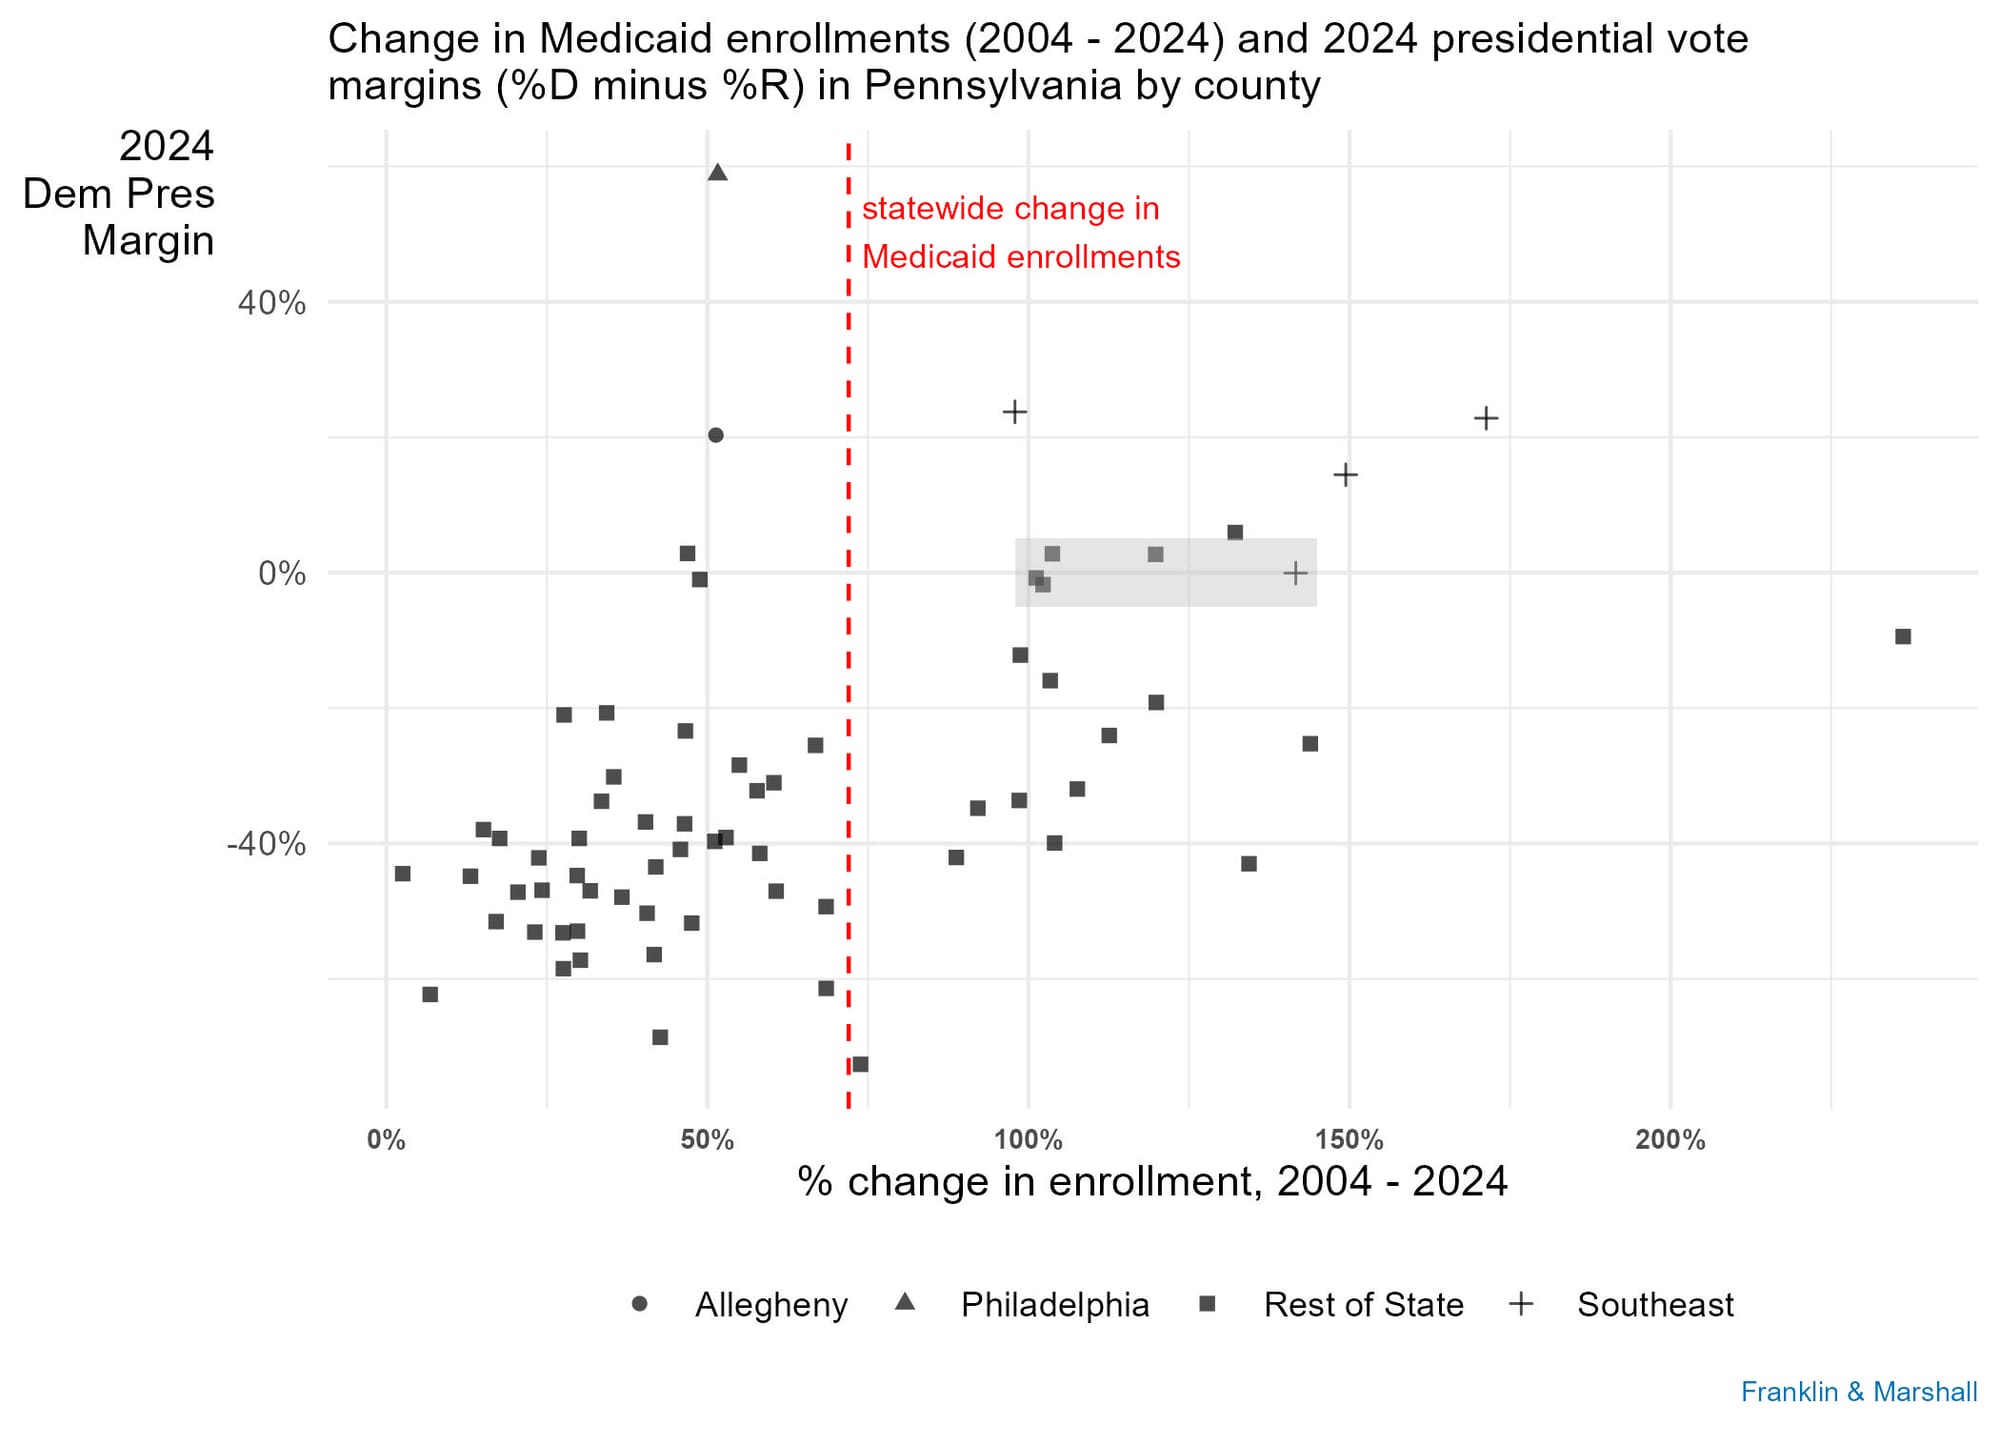
The explanation is incomplete because 2024 presidential vote margin does relate to how much growth there has been in a county’s SNAP and Medicaid enrollments over the past 20 years.[iii] Statewide, enrollment in SNAP nearly doubled between 2004 and 2024, rising from 1.03 million enrollees to 2.02 million, an increase of 97%. Statewide enrollment in Medicaid also expanded during that time period, rising from 1.74 million to 2.99 million, an increase of 72%.
Comparing the presidential results by growth in Medicaid enrollments at the county level shows something slightly different and perhaps more important from an electoral standpoint than looking at current enrollment rates. Six of the state’s eight most competitive counties have seen their Medicaid enrollments grow faster than the state average (the same is true for SNAP enrollments). Figure 2 displays the relationship between the change in Medicaid enrollment from 2004 to 2024 and the 2024 presidential vote margin in each county, with the most competitive and largest MA growth counties highlighted in gray. These counties include Bucks County in the Philadelphia suburbs, Lehigh, Monroe, and Northampton in the Lehigh Valley, and Lackawanna County in the northeast.
What is particularly dangerous for Republican messaging in Pennsylvania is that they will be trying to deliver their preferred partisan message to voters who may be less inclined to see those messages through a partisan lens. As such, the benefits reductions risk not only reducing margins in communities where Republicans dominate, but are likely to hurt their margins in the competitive counties that decide statewide elections. Even if Republican messaging can successfully convince voters in Republican areas that this is about tax cuts, not benefit reductions, that message is less likely to resonate in the most competitive counties. Driving voters towards the Democrats in the most competitive counties is a recipe for electoral disaster for Republicans.
What Does this Mean for the 2026 Midterm Election?
The polling suggests that many of the components of the OBBA are unpopular and that the bill itself is one of the most unpopular pieces of legislation passed this century. Republicans need to make up a lot of ground to compete in the messaging fights to come.
Donald Trump was elected in 2024 primarily because voters were dissatisfied with their economic circumstances. Surveys show voters aren't any happier now than they were last November about the economy, and President Trump's overall ratings on the economy are a liability for him. What seems most likely is that claims about the legislation’s effects will be judged within this economic context. If Pennsylvanians’ economic circumstances decline, so will their assessments of this administration generally and this legislation in particular.
Republicans may benefit from the fact that changes to Medicaid will not begin until after the midterms are over. But policies currently in place that have produced higher tariffs and a shrinking labor force are going to affect the country’s overall economic performance and may be a more immediate concern for voters. High interest rates and a weaker dollar created by ever increasing deficits will also weigh on voters’ assessments of their personal economic circumstances. Assessments of the economy will likely be a more consequential factor in the midterms than the OBBA, but as things stand now neither is likely to help Republicans stem the traditional losses expected for the party in power.
[i] The data about Medicaid and SNAP enrollments come from the Commonwealth of Pennsylvania Department of Human Services website (www.pa.gov/agencies/dhs/resources/data-reports.html) and were downloaded on July 8, 2025. Election data comes from the Pennsylvania Department of State.
[ii] The correlation between county-level vote margins in 2024 and the proportion of residents enrolled in SNAP or Medicaid is not significant (r = -0.01 and r = 0 .02, respectively).
[iii] The correlation between county-level vote margins in 2024 and the growth in SNAP and Medicaid enrollments is significant (r = 0.30 and r = 0.51, respectively).
Franklin & Marshall College Poll Newsletter
Join the newsletter to receive the latest updates in your inbox.