
Presidential Job Approval and Biden's Re-Election Chances in Pennsylvania
We compare President Biden's ratings with the ratings of other first-term governors and presidents in Pennsylvania to see what they tell us about his chances of carrying the state in 2024.
Dear Readers,
This month we review long-term patterns in job approval ratings to help understand President Biden’s current approval ratings in the state and how they might relate to his chances of carrying Pennsylvania in 2024. Historical job approval data suggests the President is currently in a weak position, but there are at least two other factors that will affect his chances of success. Our next statewide poll, which we expect to release on August 24, 2023, will tell us more about the President’s chances.
I’m also happy to tell you that we’ve revised our newsletter site to make it simpler to use and more interactive. If you haven’t visited the site recently, I’d encourage you to drop in for a look.
Thank you for reading,
Berwood Yost
President Biden's persistently low job approval ratings depress Democrats while inspiring glee among Republicans.[i] The President has received positive job approval ratings from, on average, one in three Pennsylvania voters since taking office.[ii] His positive ratings in the state have been as high as 44%, but sank to a low of 27% in our April poll. Many Democrats hope the President will start getting the credit they think he deserves for passing major bipartisan legislation, managing significant international conflicts, and presiding over an improving economy. Republicans think these ratings reflect legitimate concerns about his age, competence, and policies. But both camps agree that the President's approval ratings, if unmoved, doom his hopes for a second term.
Since job approval ratings are a vital political signal, it is worth comparing the ebbs and flows of President Biden's ratings with the ratings of other first-term governors and presidents in Pennsylvania over the past twenty years to better reflect on his re-election prospects.[iii]
Overview of First Term Approval Ratings in Pennsylvania
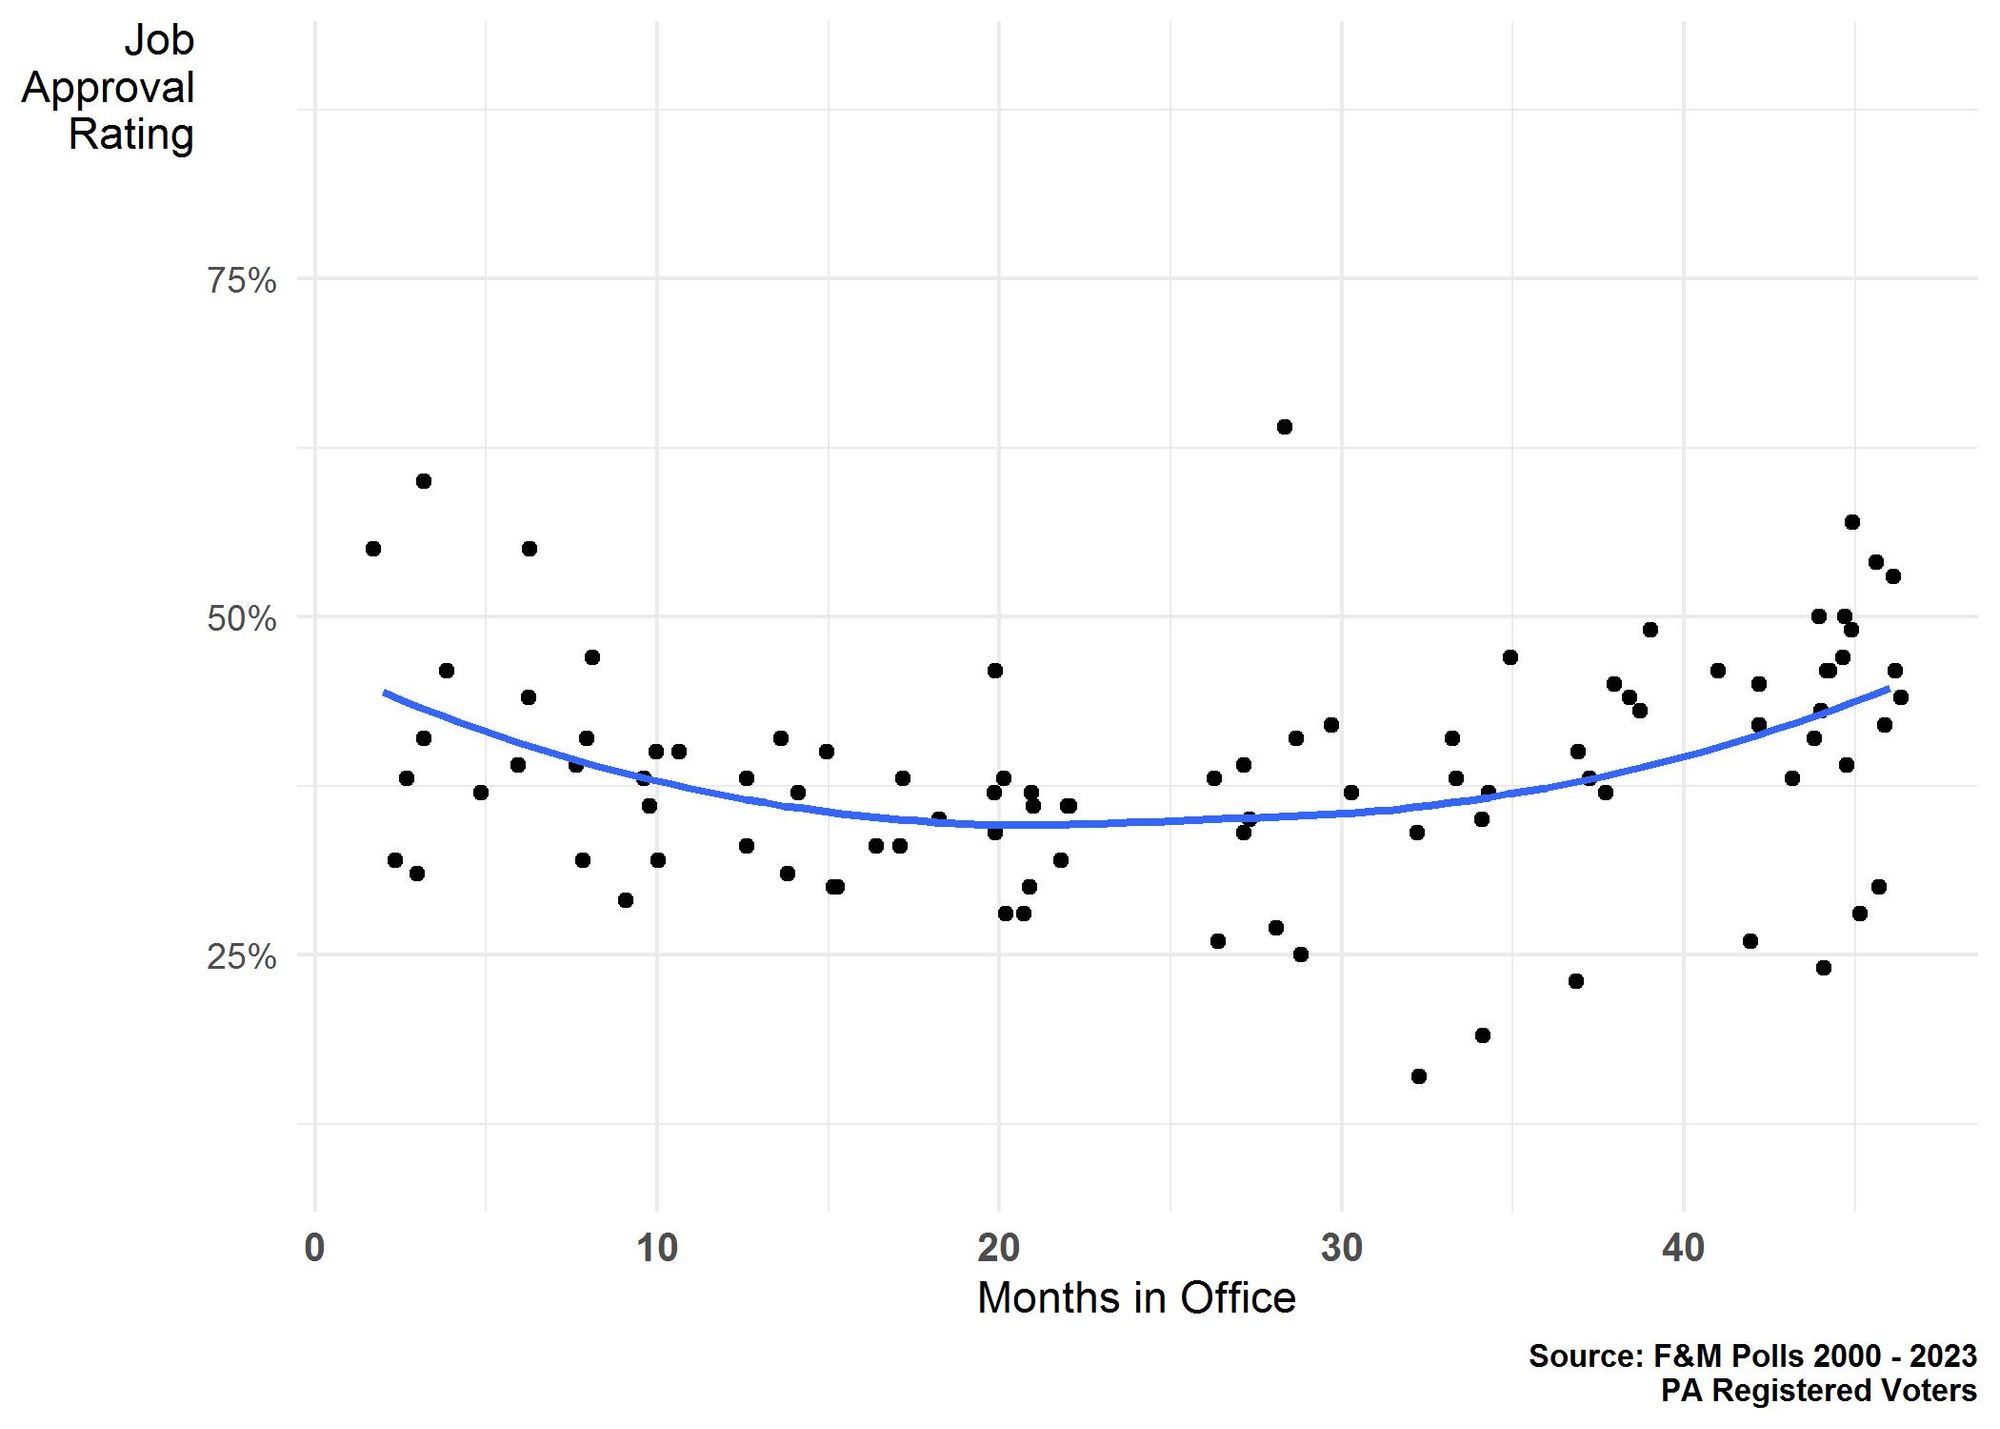
Since 2000, the Franklin & Marshall College Poll has measured the first-term job approval ratings of the state's governors and U.S. Presidents nearly 100 times. We've captured the job approval ratings of governors Ed Rendell, Tom Corbett, and Tom Wolf as well as for Presidents Bush, Obama, Trump, and Biden. There is a clear pattern in these first-term approval ratings: they are highest when a governor or president first enters office, their ratings generally decline through the first two to two-and-a-half years of governing, and they tend to rise as these elected officials start to focus on getting re-elected (note the blue line in Figure 1). President Biden has reached the point in his first term when his approval ratings should start to rise. If his ratings don't start increasing soon, his chances of winning Pennsylvania will diminish.
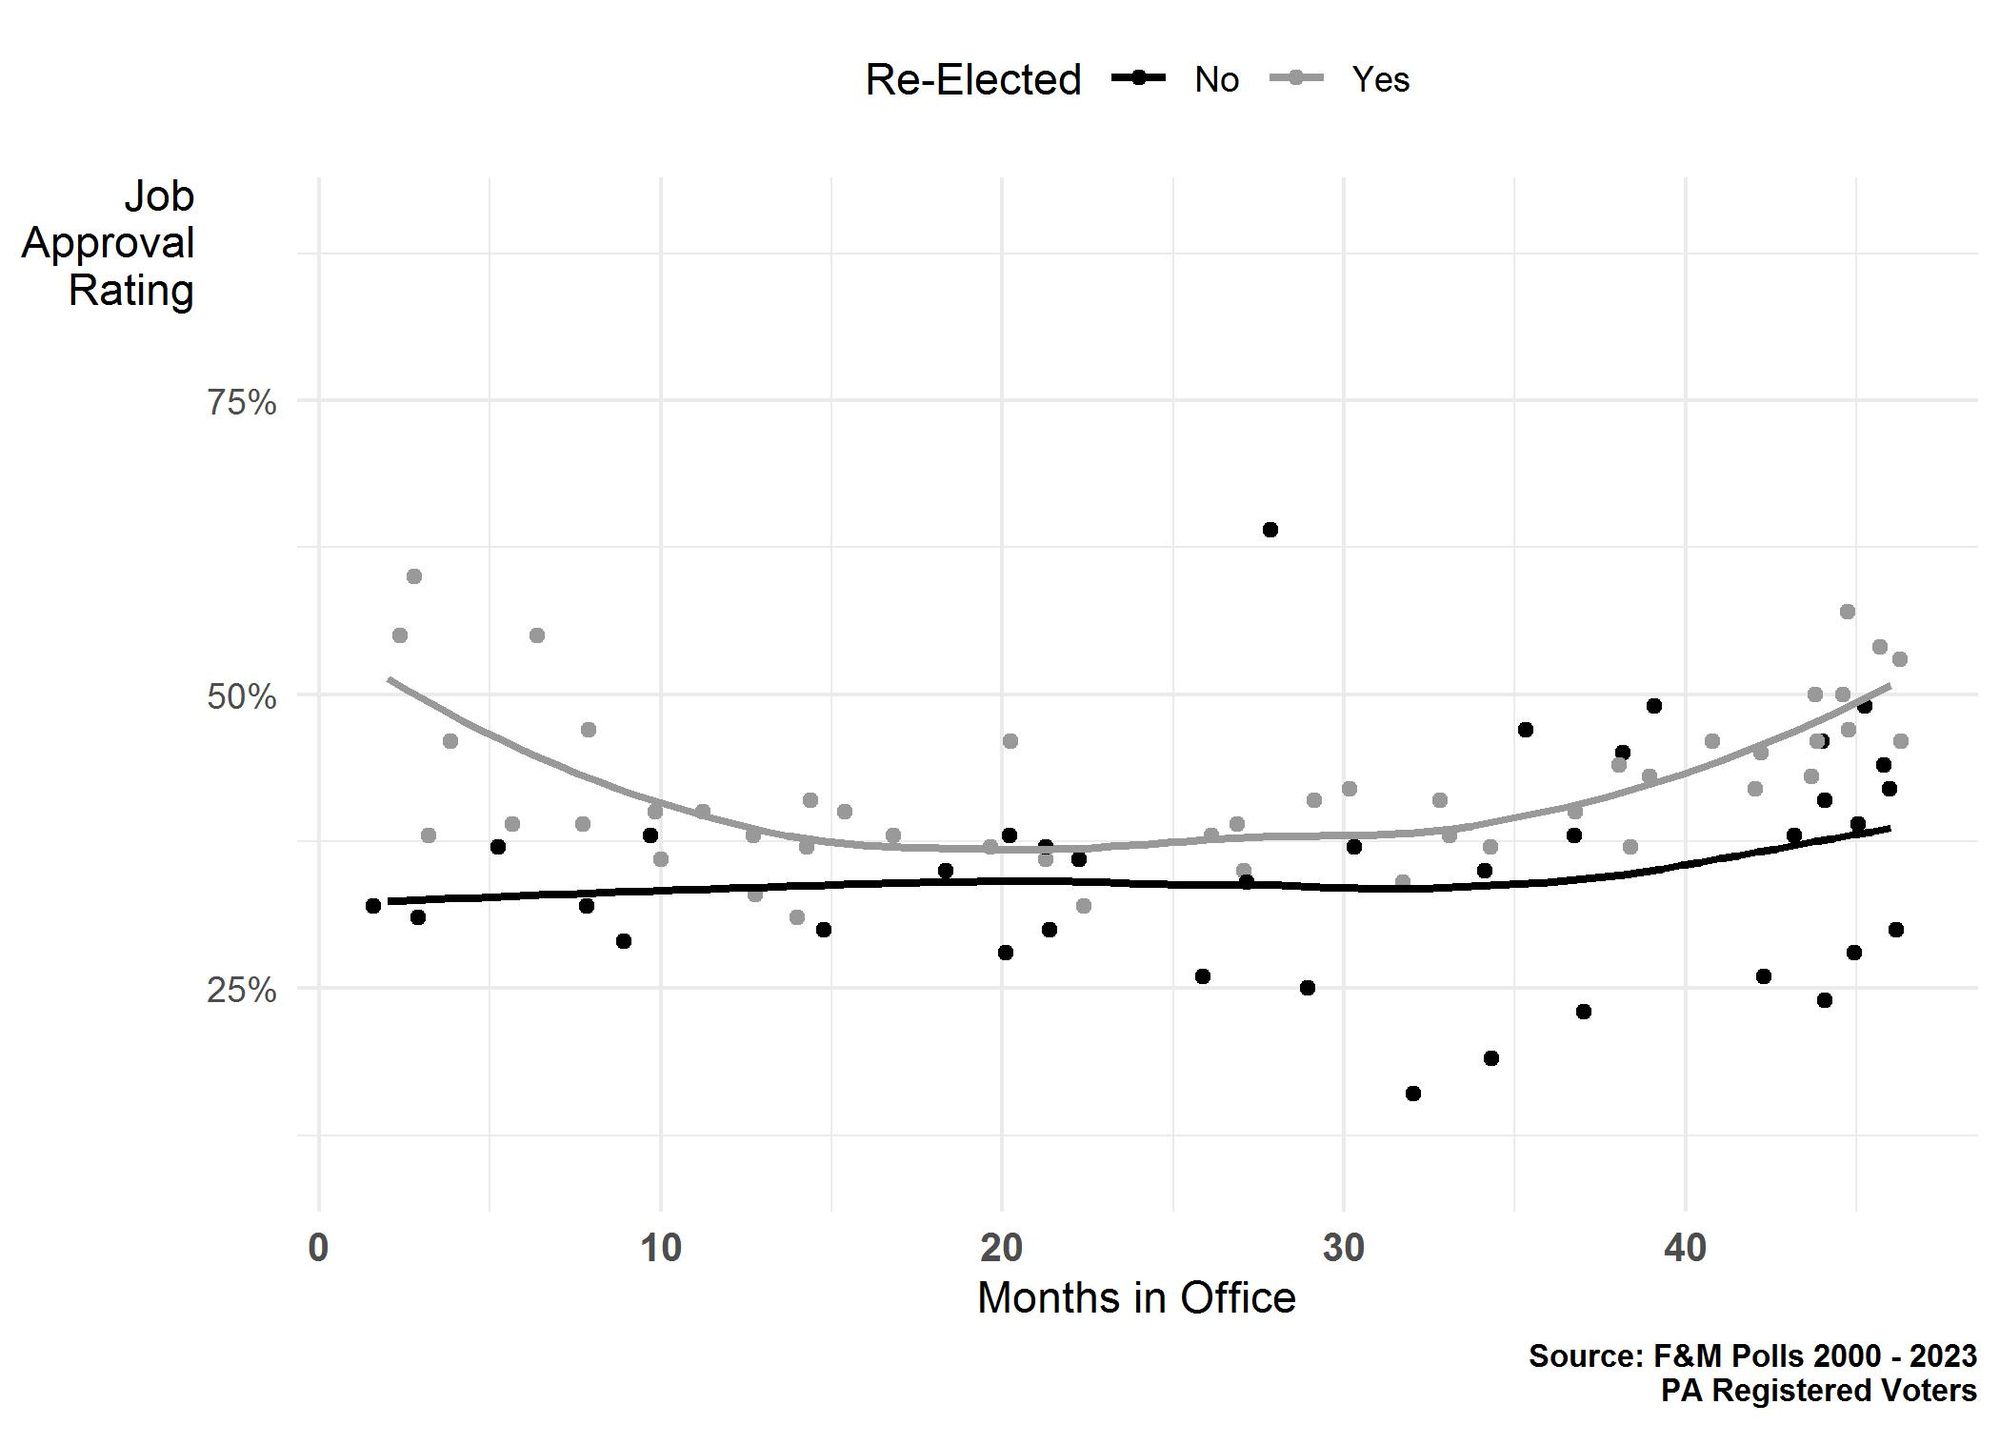
Improving approval ratings starting around 30 months in office is normal, so much so that every incumbent officeholder we've measured has improved their standing with voters after this point in their first terms.[iv] The difference between candidates who were not statewide winners and those who were is that the unsuccessful candidates tended to start their first terms with relatively low job approval ratings (Figure 2). Even though successful and unsuccessful candidates each improved their approval ratings, the unsuccessful candidates never compensated for their poor starts. The average end-of-term job approval rating for successful candidate was 51% (SD = 4.2%), but was only 39% (SD = 8.2%) for those who were unsuccessful. President Biden's positive approval rating of 41% in March 2021 is a sufficiently high floor for him to reach an approval rating that would allow him to win Pennsylvania again.
Conclusions and Caveats
Democrats are right to be worried about President Biden's re-election chances in Pennsylvania. His average approval rating in the state as well as his current approval ratings align him more closely with first-term gubernatorial and presidential incumbents who have failed to win the state than those who have been successful this century.
But there are at least two additional factors to consider before making any final judgments about where things stand for the President. The first is that polarization changes the way we need to think about approval ratings. We know that the state's voters have reorganized themselves ideologically and demographically over the past 20 years, and these changes mean partisans are less likely to abandon their party. It is hard to imagine that those who identify as Democrats will vote against the President come Election Day, even if they are less than excited about the job he's done in office. Generally speaking, polarization has made the baseline for approval ratings lower today than it was in 2000, as the average approval ratings shown in Table 1 suggest.
Table 1. Approval Rating, Challenger Net Favorability Rating, and State Share of Vote in Pennsylvania for Governors and U.S. Presidents after 2000
|
Name |
Average |
Final |
Challenger |
Re-Election |
|
Bush |
0.49 |
0.47 |
0.04 |
0.485 |
|
Rendell |
0.45 |
0.55 |
0.01 |
0.604 |
|
Obama |
0.42 |
0.47 |
-0.04 |
0.520 |
|
Corbett |
0.27 |
0.29 |
0.14 |
0.452 |
|
Trump |
0.36 |
0.41 |
0.05 |
0.488 |
|
Wolf |
0.41 |
0.52 |
-0.21 |
0.550 |
|
Biden |
0.34 |
|
|
|
Note: Bold font shows officeholders who won re-election in Pennsylvania.
The second factor is that every election is about the candidates on the ballot, not an abstract judgment about a President's performance that is separate from the choices that voters make in the voting booth. This was a main story line of the 2022 mid-term races. Come Election Day, the President will be judged in relation to how people think about his opponent as a viable alternative. Traditionally, this is measured by how favorably voters feel about a candidate. When the alternative to the incumbent is viewed less favorably than the incumbent, the incumbent tends to win (Table 1). In the end, the President's approval rating will be only part of the story.
[i] The relationship between job approval ratings and re-election success is discussed here: https://news.gallup.com/poll/311825/presidential-job-approval-related-re-election-historically.aspx
[ii] The Franklin & Marshall College Poll measures job approval by asking a question that includes four response categories (excellent, good, fair, or poor) instead of the traditional Gallup formulation that asks whether a person approves or disapproves of the officeholder's performance. The four-category format normally means that our approval ratings are a few points lower than when asked as a dichotomy.
[iii] We do not explore the approval ratings of Senators because they serve six-year terms and are not term limited like governors and presidents, but the relationship between job approval ratings and election outcomes is also true for Senators, see for example: https://www.jstor.org/stable/40263457.
[iv] Neither Governor Tom Corbett nor President Donald Trump were re-elected. President George Bush is included here as well because he lost Pennsylvania to Democrat John Kerry by 2.5 points despite winning the national vote.
Franklin & Marshall College Poll Newsletter
Join the newsletter to receive the latest updates in your inbox.