
Untangling and Explaining Voter Preferences in Our 2022 Midterm Surveys
We review the 2022 F&M polls about the Pennsylvania midterm elections, discuss how the choices we made affected how we thought about the races, and consider the lessons we will remember for future surveys.
Dear Readers,
Last month we discussed the overall strong performance of independent state polls in the midterm elections, including a reminder that the most useful polls also provide plenty of information about how they are conducted. This month, we explore this topic in more detail by reviewing how our own polls were conducted, how the choices we made affected how we thought about the races, and the lessons we will remember for future surveys.
Expect to see our next newsletter, which will feature the results of our first poll of 2023, in early April.
Thank you for reading,
Berwood Yost
Our February newsletter examined the collective performance of the state’s polls during the 2022 midterm elections. Our analyses showed that nonpartisan pollsters had a good year, with a candidate error of about 1 point and with most polls picking the correct winners in both the races for U.S. Senate and governor. In total, we summarized the midterm polling errors as generally underestimating support for the Democratic candidates and having bigger misses for governor than Senate.
This month’s newsletter focuses specifically on how the Franklin & Marshall College Poll performed during the midterms, including some analyses that attempt to untangle an interesting feature of our final survey: specifically, how did three of our four election snapshots closely match the final election results at the same time that one of them did not?
The Electoral Context
F&M’s polling throughout the fall showed conflicting signals about the midterm races. The polling produced indicators around Presidential job approval and economic concern that normally mean lopsided wins for the out party, in this case the Republicans. At the same time, the polling produced campaign-level indicators such as candidate favorability and ratings of candidate capabilities that implied the Democrats had distinct advantages. These conflicting indicators suggested that electoral conditions favoring Republicans were balanced by campaign indicators that favored Democrats.
The same was true of the issues that voters cared about. When asked about the most important issue facing the state, the economy was clearly the top concern for voters. But when we asked about what was driving their choice of a candidate, abortion was higher on the list. All in all, our polling suggested the 2022 election might not follow the patterns usually seen in a president’s first midterm.
The electoral consequences of these conflicting indicators appeared in voters’ expressed preferences throughout the fall and in our final poll, which was completed more than two weeks prior to Election Day. Our polling suggested that Republicans would win a majority of the votes cast for U.S. Congress in the state, but that the Democratic candidates were likely to win the statewide races for governor and U.S. Senate.
Table 1 shows the actual and expected vote margins. The final estimates we reported for U.S. House and Senate were notably precise, while at the same time the poll underestimated likely voters’ support for Republican Doug Mastriano in the governor’s race.
Table 1. Final Election and October Franklin & Marshall College Poll Margins by Race, 2022 PA Midterms
|
Race |
Final
Election Margin |
Final
Poll Margin |
Error |
|
Governor |
14.8 D |
22 D |
7.2 |
|
US Senate |
4.9 D |
4 D |
0.9 |
|
US House |
5.2 R |
5 R |
0.2 |
What changed between our final poll and Election Day among voters’ gubernatorial preferences that didn’t affect the other races? Perhaps a close look at the choices made to produce these estimates can answer this question.
Constructing the Estimates
Estimating voter preferences requires an analyst to make many decisions, each one of which affects a poll’s final estimates. Characterizing the state of any race includes decisions such as whether likely or registered voters are included; how likely voters are defined; whether baseline preferences or baseline plus “leaning” preferences are included; whether only voters who are “certain” about their preference are included; how undecided voters are treated, and so on. Table 2 shows the estimated candidate support in each race using several different data compilations from our final poll.
Table 2. Final Election and October Franklin & Marshall College Poll Margins by Race and Grouping, 2022 PA Midterms
|
|
|
Final Poll Estimates |
|||||
|
Race |
Vote
Returns (D
– R) |
Reported (D
– R) |
Registered Voters (D – R) |
Likely Voters (D – R) |
Registered, no leaners (D – R) |
Registered, certain (D – R) |
Likely Voters, certain (D – R) |
|
Governor |
56
– 42 |
58
– 36 |
56 – 33 |
58 – 36 |
54 – 32 |
61 – 38 |
61 – 38 |
|
US Senate |
51
– 46 |
49
– 45 |
48 – 43 |
49 – 45 |
45 – 40 |
55 – 45 |
53 – 47 |
|
US House |
47
– 52 |
41
– 46 |
41 – 46 |
47 – 48 |
- |
- |
- |
Note: The generic ballot question about U.S. House preference did not ask undecided voters if they leaned toward a party, nor did it ask how certain the respondent was about their choice.
John Fetterman’s advantage in the U.S. Senate race ranged from four points to ten points, while estimates for the congressional vote ranged from a one to a five point lead for Republicans. Clearly, these races could have been characterized differently if the results were aggregated using different criteria.
But that isn’t true for the estimates in the governor’s race. Table 2 shows that the range of possible estimates in the governor’s race was only three points, ranging from 22 to 25 points. In fact, none of the different data compilations would have produced a closer race. So, estimating the vote for governor differently would not have produced a narrower Democratic advantage given the data we had. If the way we configured our data isn’t the problem, could our data collection procedures themselves have missed a sliver of Mastriano supporters?
Collecting the Data
The share of a sample that participates in a survey is known as the survey’s response rate, and these rates have been in steady decline for years. Declining response rates leave the impression that survey samples no longer represent voters. The concern is that people who participate in surveys are different from those who do not, and that the different characteristics of participants and non-participants leave some views underrepresented.
Table 3 provides the dispositions for the August, September, and October Franklin & Marshall College Polls conducted during the 2022 midterm. Dispositions for all three surveys are combined since the outcomes were the same proportionally from month-to-month. Table 3 shows our primary problem in finding survey participants is reaching them: most of our calls ended with only a voicemail message (51%) or with no answer (4%). Refusal rates are not terribly high; only about 4% of respondents said they would not talk to our interviewers. Because we do not have telephone numbers for all respondents, about one in five cases ended with no response at all. As a reminder, the first step we take in recruitment is mailing a postcard that tells people we will be calling and how they can participate. This means everyone in our sample has the opportunity to respond even if we do not talk with someone in the home. In fact, about 4% of our completed surveys are provided by participants we never speak with, but who go online and complete their survey when they receive the postcard.
Table 3. Disposition Codes for August, September, and October Franklin & Marshall College Polls
|
Outcome |
Frequency |
Percent |
|
Voicemail |
24034 |
51.4 |
|
Busy |
253 |
0.5 |
|
No Answer |
2008 |
4.3 |
|
Disconnected |
7064 |
15.1 |
|
Refusal |
2111 |
4.5 |
|
Call Back |
238 |
0.5 |
|
Ineligible |
138 |
0.3 |
|
Partial |
3 |
0.0 |
|
Complete |
1669 |
3.6 |
|
No Response |
9260 |
19.8 |
|
Total |
46778 |
100.0 |
The samples used to recruit participants include information about each person, including the county where they live, their age, gender, party registration, and past voting history, among other details. This sample data tells us a bit about how those we interviewed differed from those we did not.[i] While the data shows that response rates differed by party, there were much stronger effects for past vote history and region of the state, as shown in Figure 1. The lines in Figure 1 represent the adjusted likelihood of participating in the survey based on party, gender, past vote history, and region of the state accounting for a respondent’s age and contact information (i.e., mail, email, phone, or some combination of those).
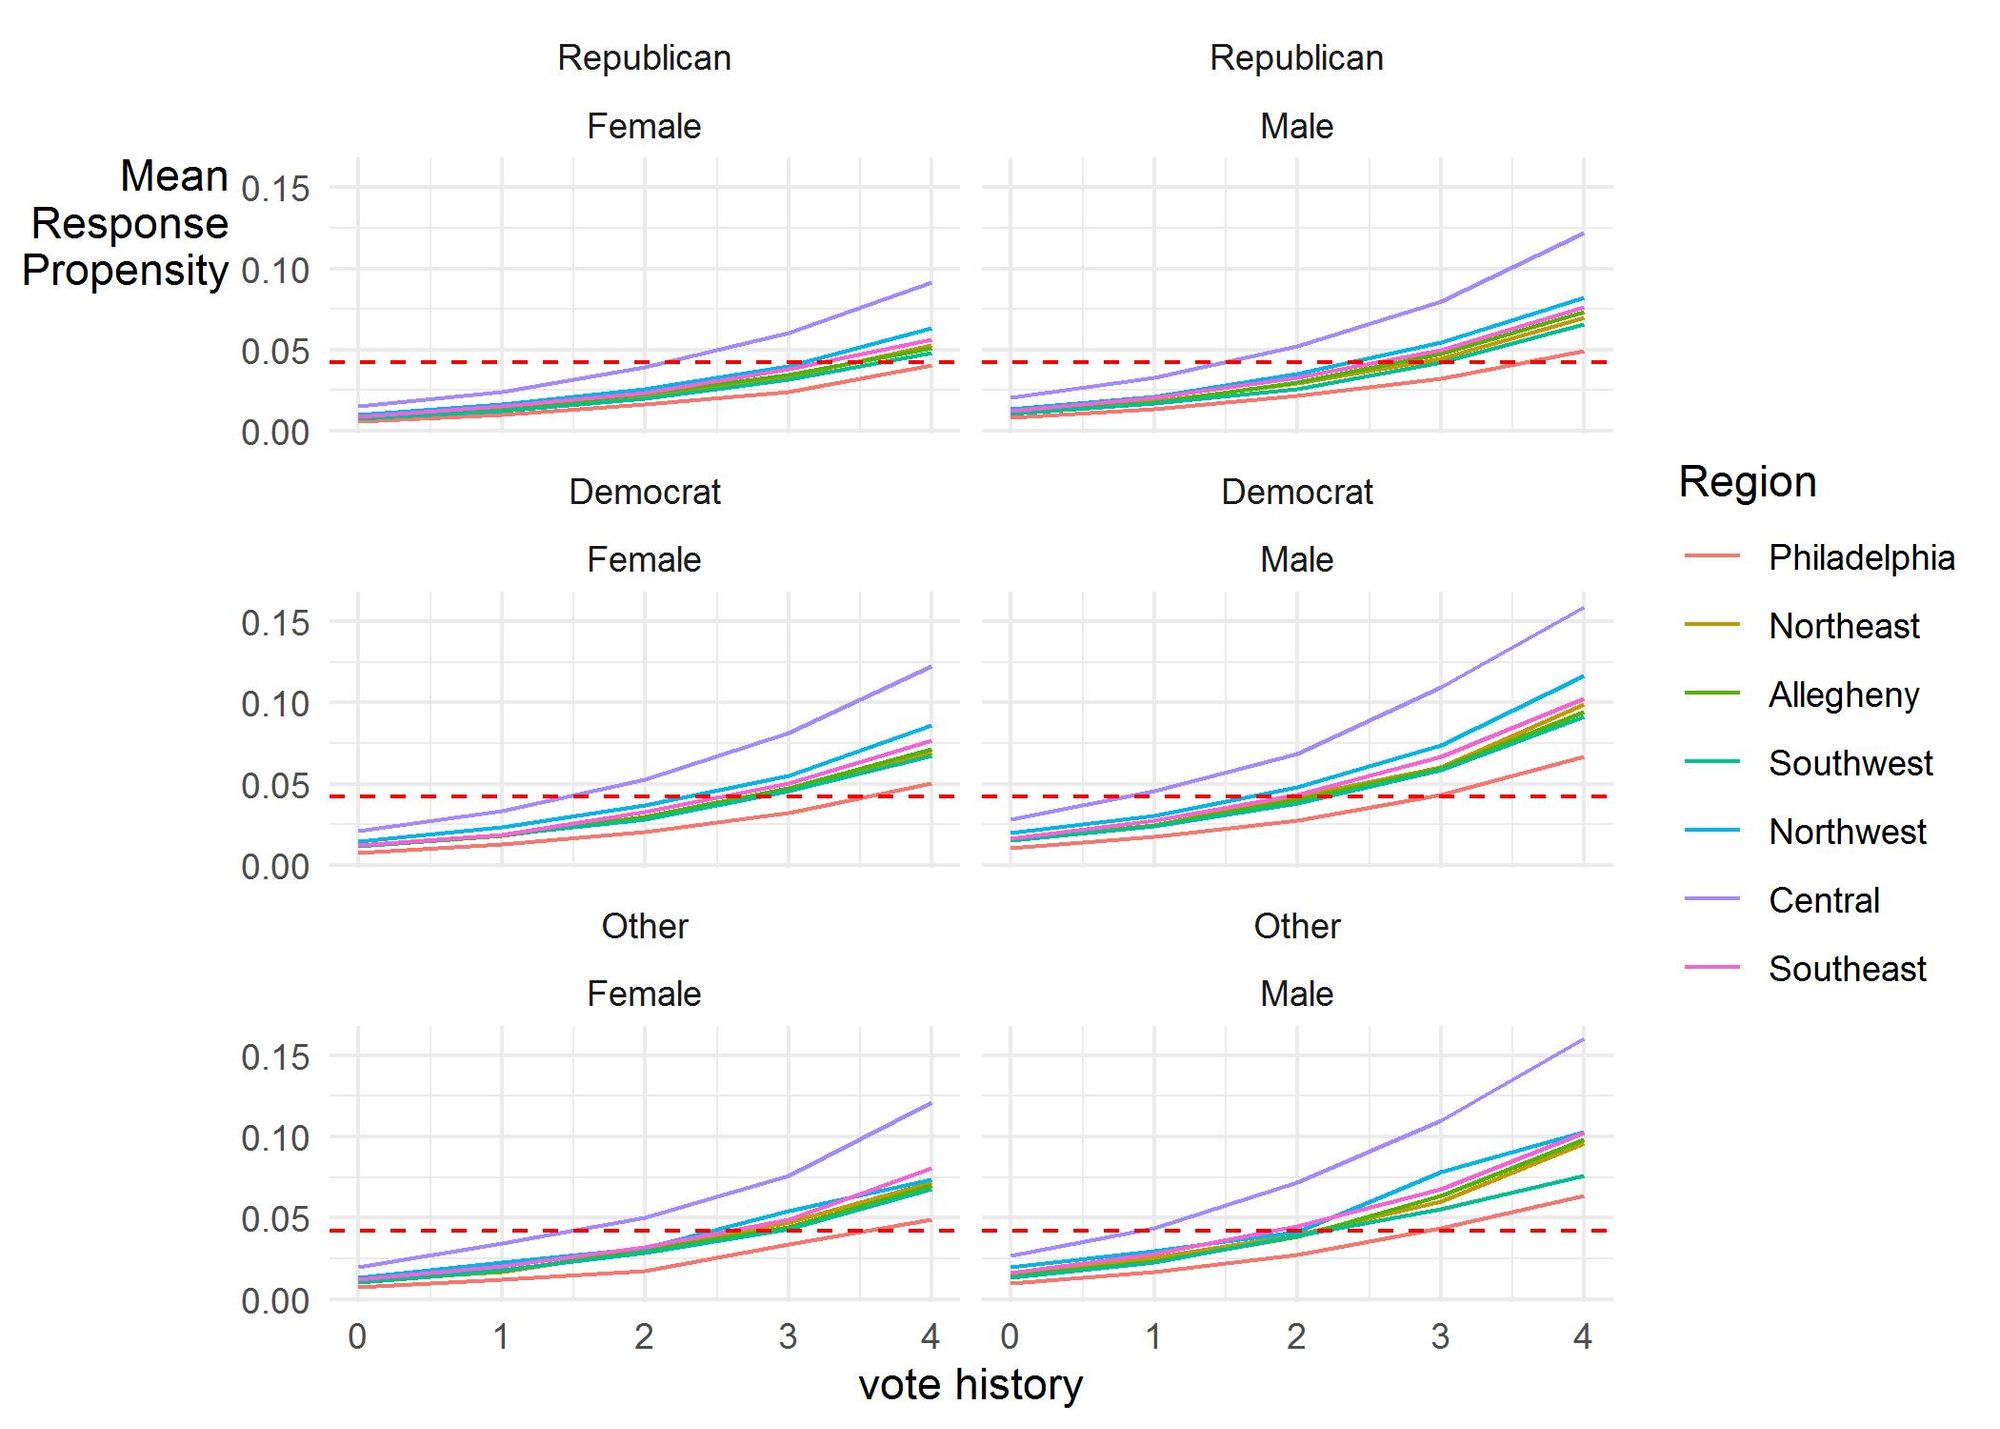
A sampled person’s likelihood of participating in a survey increased the more often they’ve voted in recent general elections and is the strongest influence on survey participation. Our sample had a modest bias toward those who participate in elections more often, which is likely why our registered and likely voter estimates tend not to differ a lot. Residents of Philadelphia are less likely than residents from other parts of the state to participate, while Central Pennsylvania residents were most likely to participate, perhaps because Franklin & Marshall College is more recognizable to respondents within this area. There are slight differences in participation between men and women, with men generally being more likely to participate, all else being equal.
We are able to account for these patterns of response by using statistical adjustments to balance the sample. These adjustments made the characteristics of our survey respondents resemble the sample characteristics and thus the state’s voters. In addition to producing the estimates shown in Table 1, this balancing also created estimates suggesting that 63% of the registered voters in our sample would turn out to vote, which was close to the actual turnout of 61%.
The accuracy of these turnout estimates as well as the accuracy of the estimates for the U.S. Senate and U.S. House races does not completely rule out the possibility that non-response was at work in the gubernatorial race. But the accuracy of our estimates suggests that if non-response is to blame (1) it must represent a relatively narrow group of voters, and (2) missing these voters had no effect on the other races or on turnout.
Voting Patterns
Analyzing the joint preferences of survey participants in the U.S. House, U.S. Senate, and gubernatorial races might offer some insights about who or what was missing from our estimates in the governor’s race. The largest share of respondents planned to vote a straight party ticket (see Table 4), either for the Democrats (37%) or the Republicans (30%). Table 4 shows how the October Poll’s participants planned to vote in the three races we tracked as well as the share of voters in each group.
The expressed preferences among those who planned to vote for a Republican U.S. House candidate but not for a Republican in at least one of the other races, the column highlighted in Table 4, shows an interesting pattern of under-reporting for Mastriano compared to Oz. Most (59%) of these voters planned to vote for Oz in the Senate race, but only four percent of the same voters planned to vote for Mastriano for governor. It seems likely that a much larger share of these voters ended up voting for Mastriano than reported doing so in the final poll.[ii] In fact, if he received most of the undecided voters and most of the voters in this group who said they were voting for a third party candidate, our final poll estimates would closely align with the actual vote share.
Table 4. Pennsylvania U.S. Senate and Gubernatorial Preference by Combined Voting Preferences
|
|
US House, US Senate, and Gubernatorial Voting
Preference |
|||||
|
Straight R (30%) |
Straight D (37%) |
R
House and D or O (14%) |
D House and R or O (3%) |
Other (16%) |
||
|
US Senate |
Fetterman |
0% |
100% |
13% |
17% |
54% |
|
Oz |
100% |
0% |
59% |
16% |
20% |
|
|
Other |
0% |
0% |
18% |
30% |
16% |
|
|
Undecided |
0% |
0% |
10% |
37% |
10% |
|
|
Governor |
Shapiro |
0% |
100% |
55% |
45% |
62% |
|
Mastriano |
100% |
0% |
4% |
8% |
8% |
|
|
Other |
0% |
0% |
21% |
19% |
11% |
|
|
Undecided |
0% |
0% |
20% |
28% |
19% |
|
Lessons Learned
One of the main takeaways from our February 2023 newsletter about the performance of the polls in the 2022 midterms was that pollsters who fail to disclose how they conduct their research are best ignored. Each Franklin & Marshall College Poll report provides a description of how the poll was conducted, including access to the full questionnaire. Hopefully, the details about our own polls provided in this newsletter help clarify why knowing the many choices a pollster makes is so important to understand.
Pre-election surveys can provide a great deal of information about political campaigns. Well-designed polls offer ample context about elections and a better understanding of how voters’ choices are being made. And despite their limitations, they normally do a better job than pundits of describing what is happening.
In our own polling this year, most of the estimates we produced about the election were on the money, but we seemed to have overstated Democratic support in the governor’s race. The most plausible explanation for the results we saw in the gubernatorial race is that many who preferred Republican US House candidates were unsure about voting for Mastriano, but in the end it looks like they decided to vote for him on Election Day.
This provides an important lesson—voters sometimes change their minds during a campaign, about the candidates they prefer and about their intentions to vote. This is why the context that polls provide is more important than any single horse race number. Feelings about candidates, issue priorities, economic well-being, partisan preferences, and general interest are more immediate and less likely to change. This contextual information is also so useful because the pollster needs to make fewer decisions about reporting those items.
Another lesson may be how we should think about the vote share for non-traditional candidates. Doug Mastriano ran an unorthodox campaign that seems to have made some Republican-leaning voters unsure about supporting him. Does that mean they were not honest about their choice, or that they just weren’t sure and ultimately voted their general predispositions? We cannot say for sure from our data, but what we can do is remind readers to assume that a candidate who is under-performing among their own partisans is likely to get a larger share of them than what early polling suggests.
Endnotes
[i] Survey researchers have developed statistical methods that assess the amount of bias in a sample that comes from respondents choosing not to participate. One commonly used method, called the Representativity or R-indicator, uses variables within the sample file to create a propensity score that estimates the probability of participating. The propensity score is used to calculate the indicator, which ranges from 0 to 1. The closer R is to 1, the lower the risk of selection bias. The R-indicator for our October Poll was 0.933, suggesting a low risk of bias from non-response.
[ii] Comparing the joint vote preferences from our October Poll with the ABC News Exit Poll for the state provides a useful comparison for our final estimates. Our final poll showed fewer Oz-Mastriano voters than the exit polling. This was also true for Shapiro-Fetterman voters, but to a lesser extent.
Joint Votes Shares: October F&M Poll (ABC News Exit Poll)
Fetterman voters who voted for Shapiro: 96% (98%)
Oz voters who voted for Mastriano: 75% (89%)
Shapiro voters who voted for Fetterman: 82% (90%)
Mastriano voters who voted for Oz: 98% (98%)
Franklin & Marshall College Poll Newsletter
Join the newsletter to receive the latest updates in your inbox.