
Nationalization in Pennsylvania's 2022 Midterm Races
This month's newsletter examines split-district voting in Pennsylvania state house elections to see how much nationalization exists, and how this voter behavior has changed over time.
Dear Readers,
This month we look at split-district voting in Pennsylvania state house elections to see how much nationalization exists among voters, as well as assessing how that behavior has changed over time. This analysis explores some questions that emerged from our book about nationalization in Pennsylvania’s 2020 election by using the 2022 midterm and 1992 presidential races as points of comparison. The results show increasingly nationalized voter behavior, but leave open the question about why that behavior is evident and whether the patterns we observe are a product of voter preferences or systemic constraints.
Expect to see our next newsletter, which will feature the results of our first poll of 2023, on April 13th.
Thank you for reading,
Berwood Yost
Talk of an increasingly nationalized electorate is a common topic of conversation among those interested in politics. It is a topic that, along with polarization, we wrestle with in our book about the 2020 election (you can read more about the book or order a copy here). The strongest case for nationalization comes from the behavior of voters, so we were surprised to find in our book’s case studies that district-level returns showed split results between presidential preference and district-level preference in eight of the eighteen races studied. These case study findings made us wonder if the 2020 races were unusual and if the ticket splitting we saw for the presidential vote would be different for other, non-presidential races.[i]
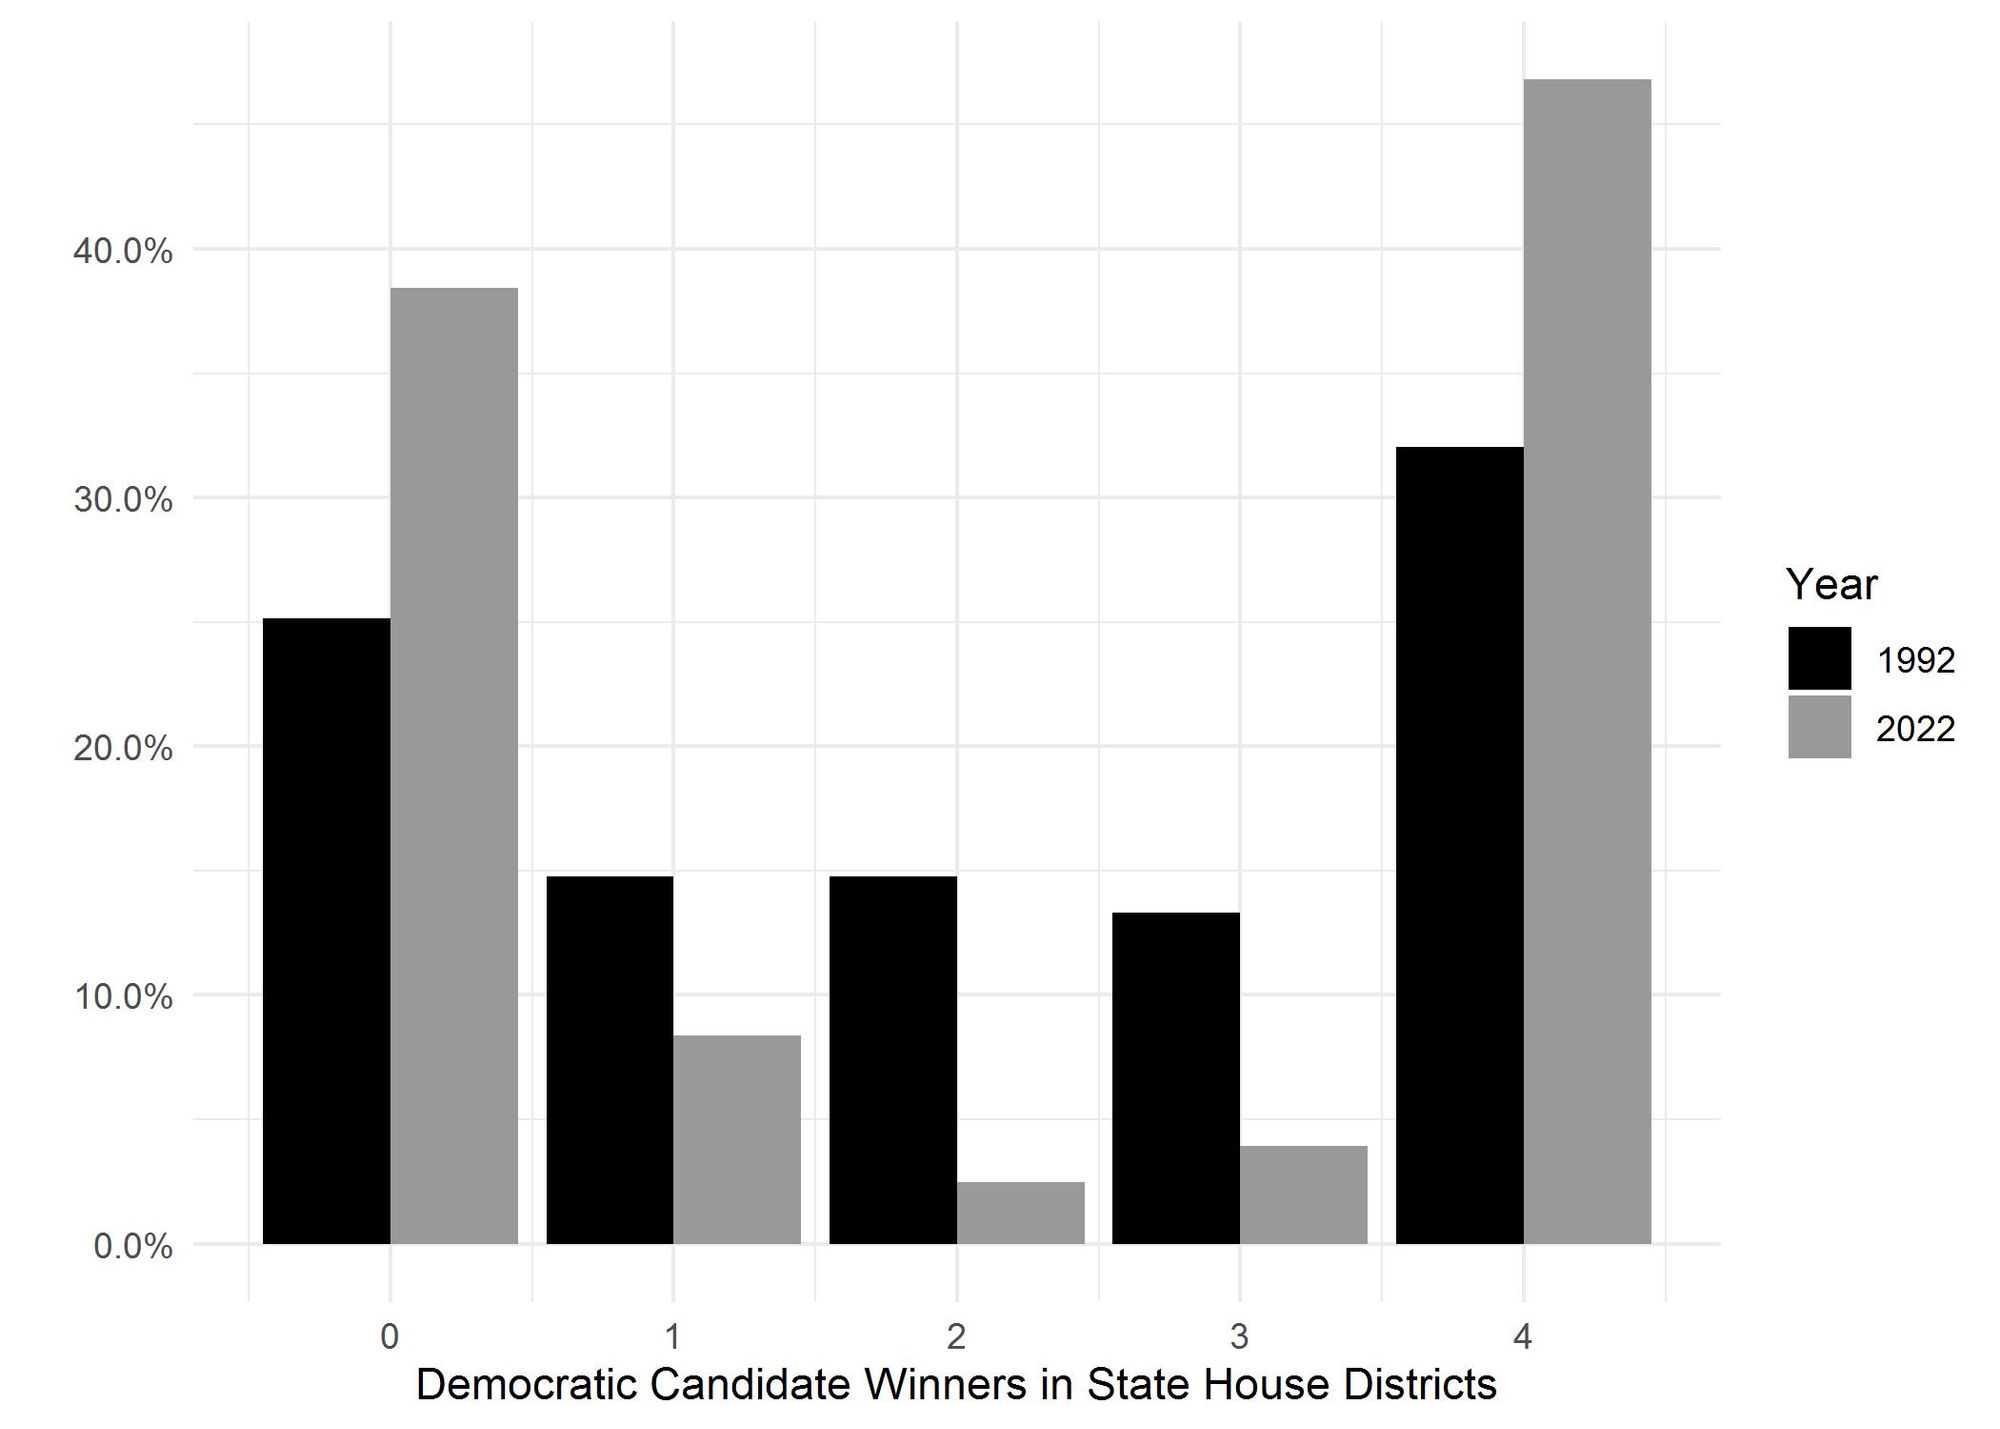
To explore this a bit more than we were able to do in our book, I calculated how often voters in the state’s 203 house districts voted for at least one candidate from a different party in the 2022 midterms. To do this, precinct-level voting data was aggregated within each state house district for the 1) state house, 2) congressional, 3) US Senate, and 4) gubernatorial candidates. The score produced for each house district is the number of times the Democratic vote exceeded the Republican vote in each of these four races. A score of zero means that Republican candidates won all four races and a score of four means that Democratic candidates won all of them. I repeated this process for the 1992 general election in Pennsylvania to provide some context, with the only difference in the scoring being the presidential vote instead of the gubernatorial vote. The more that voters align their votes for national offices with their vote for state offices, the more nationalization is evident.
Figure 1 shows that there were far fewer split-district returns in 2022 compared to 1992. In 1992, more than two in five (43%) state house districts produced candidates from different parties as winners. The 2022 midterms produced only one in seven (14%) split districts. The numbers are striking: in 1992, 30 districts voted for two Republicans and two Democrats, but by 2022 there were only five of these evenly-split districts. This same pattern is apparent if the data are aggregated at the Congressional District level, too. In 1992, 12 of 21 districts had split results compared to only 3 of 17 in 2022. You can see the geographic distribution of the 2022 midterm state house voting here.
The patterns in this data mirror the patterns in the relationship between presidential and congressional vote that are often used to promote the nationalization hypothesis. There are currently only 14 Congressional Districts that voted for Joe Biden in 2020 and are represented by a Republican, and only 13 that voted for Donald Trump represented by a Democrat, which is about one in twenty districts (6.2%). In 1992, one in four (23%) congressional districts were split.
So, partisan voting seems to be as common in Pennsylvania as it is elsewhere, consistent with the expectations of nationalization. Our research has found that nationalized voting happens despite messaging from congressional and state legislative campaigns that is not always nationalized. Our book offers a number of ideas about why voting behavior is nationalized when campaign messaging is not, with one prominent factor being the way that structural features like “federalism, the two-party system, primaries, gerrymandered districts, and the media landscape, to name only a few, are likely to influence the level of nationalization we observe.”
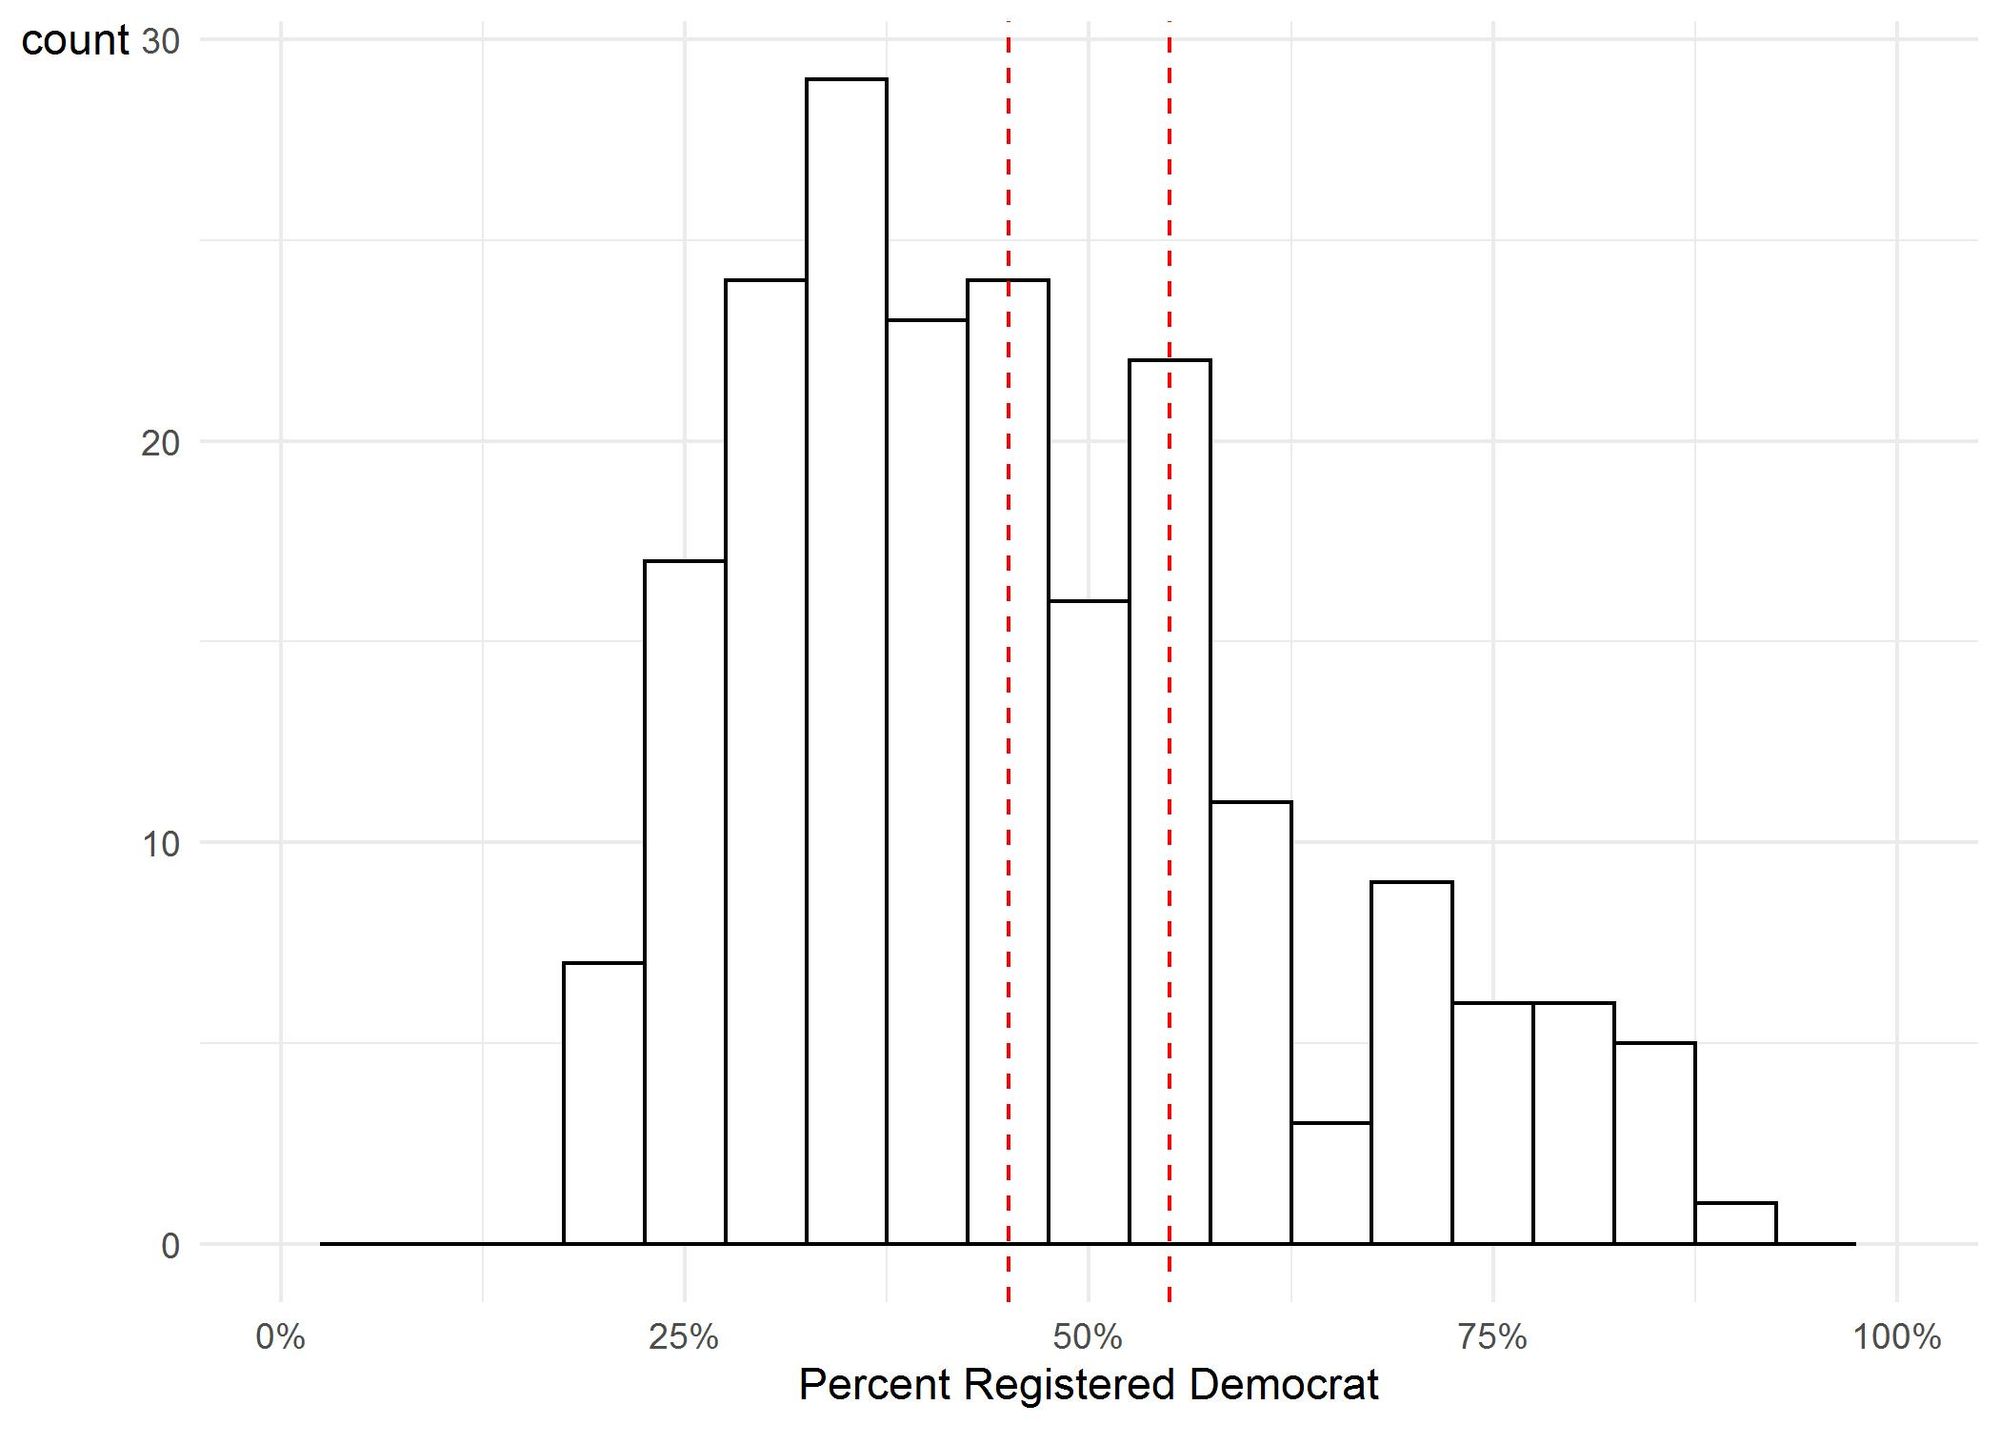
One of these structural elements, the composition of our electoral districts, undoubtedly makes nationalization and its counterpart, polarization, more prominent. As noted above, only one in seven (14%) state house districts in the state produced split-district results in 2022, which is about the same proportion of state house districts that have a voter registration gap of ten points or less (16%). Figure 2 shows the distribution of partisan registration within Pennsylvania’s state house districts, underscoring how noncompetitive most of them are.
There are many questions about nationalization that we need to understand better, including its relationship to polarization, but it seems clear that the functioning of our two-party system is helping drive nationalized behavior, whether voters want it to or not.
Endnotes
[i] Data compiled after the book went to press found that 19 state house districts produced split-district results for President and state house, which represents about 9% of races. Six of our 12 state house case studies had split-district results.
Franklin & Marshall College Poll Newsletter
Join the newsletter to receive the latest updates in your inbox.