
Franklin & Marshall Poll Release: March 2026
The first poll of the year explores the mood of the state’s voters and their positions on a number of contemporary issues--including federalizing elections, ICE enforcement, democracy, and the separation of powers—in addition to their ratings of state political figures.
Dear Readers,
I’m writing to share our summary report for the March 2026 Franklin & Marshall College Poll. I've highlighted a few of the key findings below, but I encourage you to read the full report which is attached. The poll explores the mood of the state’s voters and their positions on a number of contemporary issues--including federalizing elections, ICE enforcement, democracy, and the separation of powers—in addition to their ratings of state political figures. The full report includes cross-tab tables as attachments for six key questions, including personal financial well-being, job approval ratings for Governor Shapiro and President Trump, confidence in ICE, and federalizing elections.
Thank you for reading,
Berwood Yost
Key Findings
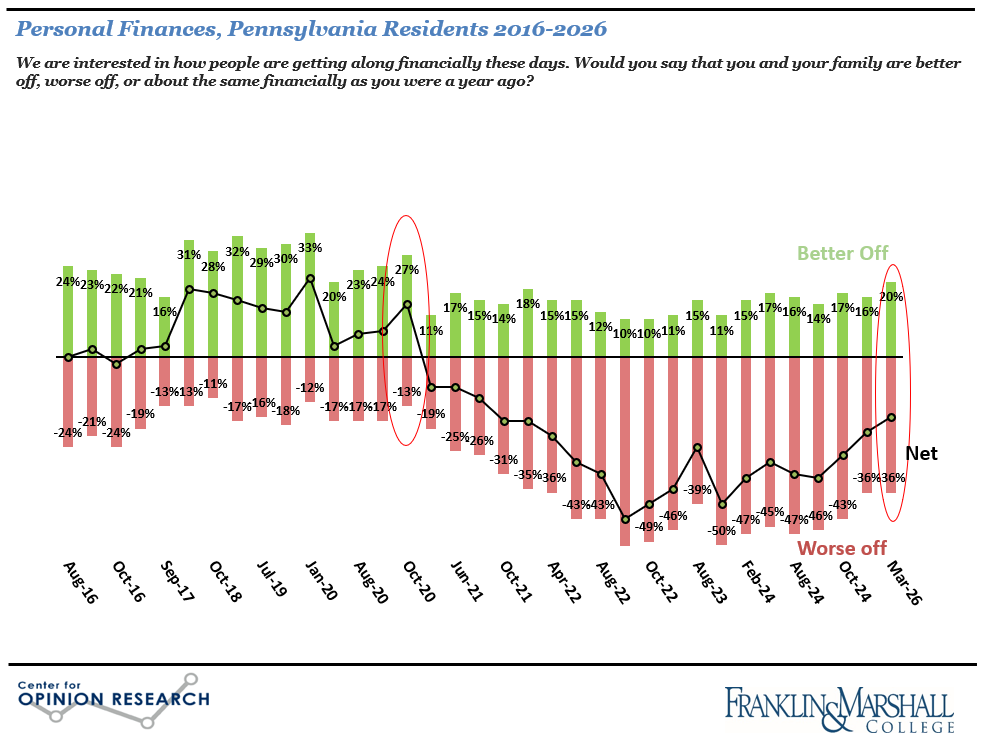
The March 2026 Franklin & Marshall College Poll finds that more registered voters believe the state is “on the wrong track” (44%) than believe it is “headed in the right direction” (39%). The last time a majority of registered voters believed the state was headed in the right direction was January 2020. Nearly two in five (36%) respondents say they are “worse off” financially than a year ago, the same as in the October 2025 F&M Poll, and only 20% say they are “better off” (see Figure 1). Voters report the economy (30%), including unemployment, housing and real estate costs, and higher gas and utility prices, is the most important problem facing the state. Among those who mention economic problems, Democrats lead Republicans as the party that can best handle the issue, 45% to 25%.
State Politics
The concerns registered voters have about the direction of the state and their own personal finances have not harmed Governor Shapiro’s job approval ratings. More voters believe he is doing an “excellent” or “good” job (50%) as governor than believe he is doing a “fair” or “poor” job (44%). Governor Shapiro currently leads his Republican challenger, Stacy Garrity, 48% to 28% in the 2026 governor’s race.
Presidential Ratings
Fewer voters believe President Trump is doing an “excellent” or “good” job (39%) as president than believe he is doing a “fair” or “poor” job (61%), which is a poorer rating than the state’s voters provided him last October. The president’s approval ratings for his specific policy actions around immigration and foreign affairs have declined since October. The Trump administration ratings for dealing with immigration slid from 47% “excellent” or “very good” in October to 42% now. The administration’s rating for handling foreign policy matters has also declined, from 42% to 37%.
ICE Tactics
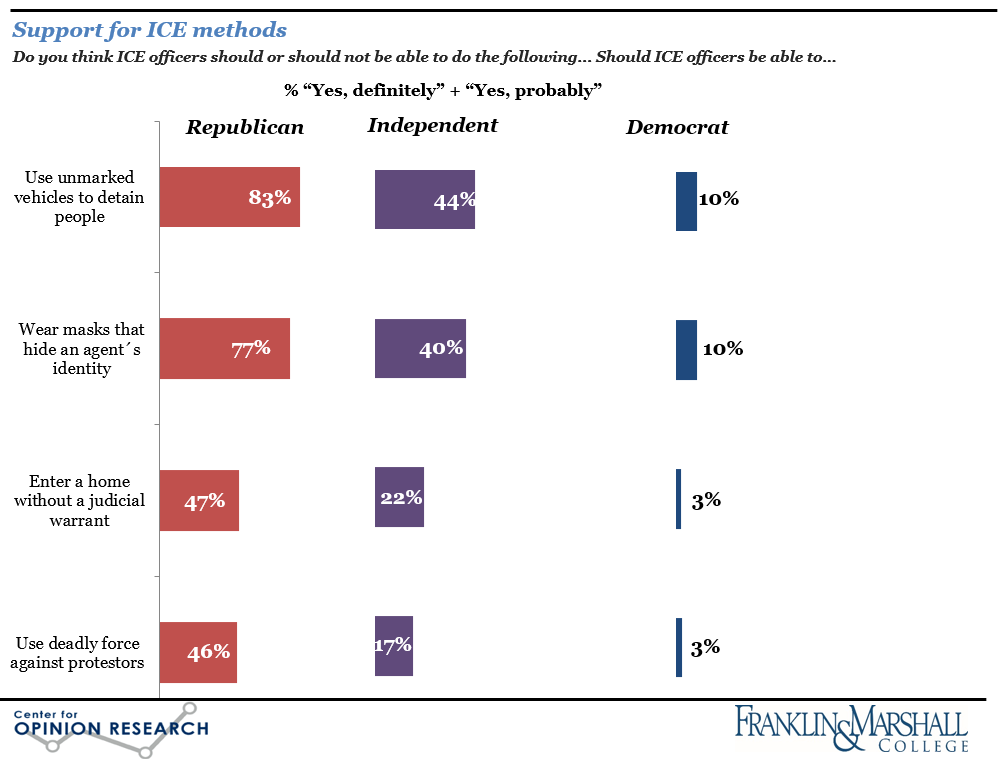
Nine in ten (94%) registered voters say they are “closely” following the administration’s immigration and deportation activities, and more oppose (55%) than support (45%) the methods that ICE is currently using to enforce immigration laws. Large majorities do not believe ICE officers should be able to use deadly force against protestors (76%) or enter a home without a judicial warrant (75%), while narrower majorities do not believe they should be able to wear masks (57%) or use unmarked vehicles (53%). Figure 2 shows the partisan support for ICE tactics.
A small majority (54%) of the state’s registered voters believe that non-citizens who have been in the US for less than five years, even if they have no criminal record, should be targeted for deportation. Voters are divided about whether non-citizens who have been in the US for more than five years and have no criminal record should be targeted for deportation (48% say yes and 49% say no) and about whether non-citizens who have families in the US should be targeted (46% say yes and 51% say no). Large majorities oppose targeting those with asylum or protected status (76%), those with a visa or green card (86%), those in the process of naturalization (89%), and those who have been naturalized (89%).
Election Integrity
Two in three (66%) registered voters have a great deal or fair amount of trust in the processes used to run elections in the state, despite there being significant differences between partisans. More than 70% of the state’s registered voters oppose changing election administration from state to federal control.
Methodology
The survey findings presented in this release are based on the results of interviews conducted February 18 – March 1, 2026. The interviews were conducted at the Center for Opinion Research at Franklin & Marshall College. The data included in this release represent the responses of 834 registered Pennsylvania voters, including 353 Democrats, 347 Republicans, and 134 independents.[1] The sample of voters was obtained from Aristotle. All sampled respondents were notified by mail about the survey. Interviews were completed over the phone and online depending on each respondent’s preference. Survey results were weighted (age, gender, education, geography, vote history, and party registration) using an iterative weighting algorithm to reflect the known distribution of those characteristics. Estimates for age, geography, and party registration are based on active voters within the Pennsylvania Department of State’s voter registration data. Gender and education are estimated using data from the November 2022 CPS Voter Registration Supplement.
The sample error for this survey is +/- 4.1 percentage points when the design effects from weighting are considered. In addition to sampling error, this poll is also subject to other sources of non-sampling error. Generally speaking, two sources of error concern researchers most. Non-response bias is created when selected participants either choose not to participate in the survey or are unavailable for interviewing. Response errors are the product of the question and answer process. Surveys that rely on self-reported behaviors and attitudes are susceptible to biases related to the way respondents process and respond to survey questions.
[1] The data reported here is voter REGISTRATION and is consistent with past reporting practices. The survey also asked about self-reported voter IDENTIFICATION, which shows a slightly different partisan split: 42% identify as Republican (n=333), 10% as independent (n=83), and 45% as Democrat (n=356) and the balance not offering a response. Partisan comparisons in this summary show self-reported registration.
Franklin & Marshall College Poll Newsletter
Join the newsletter to receive the latest updates in your inbox.