Polling in the 2022 Pennsylvania Midterms
Analysis of the 2022 Pennsylvania midterm election polls, with an eye to understanding political poll performance and polling error.
Dear Readers,
There has been surprisingly little written about the performance of the polls in the 2022 midterm election, despite some notable misses. This post describes the polling error and offers some reminders and resources for you to use as you think about the quality of a specific poll and about what the polls are collectively showing about any given election. Expect to see our next newsletter in early March and our first poll of 2023 later that month.
Thank you for reading,
Berwood Yost
Shrug
There has been surprisingly little conversation about the performance of the polls in the 2022 midterm elections. An internet search about midterm polling outcomes produces few hits compared to similar searches about the 2016 or 2020 races.
One of the few discussions I found about the polls’ performance actually appeared before Election Day. A Republican strategist from Pennsylvania was arguing a week before the election that academic pollsters were biased against Republicans in the 2022 midterms, as they had been in the last two presidential elections. He opined that,
The bottom line is that recent [midterm] polling has detected a trend toward GOP candidates with the big issue of the economy dominating with voters — as it normally does. Republicans are looking more and more likely to gain control of the Senate and not by a small margin. The House has been locked in for them for over a year.
It may appear now to be a sudden change, but the real story of 2022 may end up not that the Democrats collapsed into a rout but that they were always behind, the polls just missed it.
Though this perspective is clearly wrong in hindsight, the argument was plausible. Polls have understated Republican support in the last two presidential election cycles, so it was reasonable to think that the problems confronting pollsters in recent elections could continue. Then again, over time polls have not been consistently biased against either party. State-level presidential polls since 2000, for example, have had a bias toward Democrats in three elections and a bias toward Republicans in three elections. National polling going back to the 1960s shows the same pattern—polling errors in favor of one party have never appeared more than twice in a row.[i]
How did the polls perform?
The Pennsylvania midterm polls had a tough year when using the criteria people normally use to assess polling error, even though they did not overstate support for Democratic candidates as in 2016 and 2020. Table 1 compares the polling in the 2022 Pennsylvania U.S. Senate and gubernatorial races to Pennsylvania polls conducted in the past four presidential elections.[ii] Half of the 2022 midterm polls in both races were biased, and only half of the senate polls chose the correct winner.[iii] The candidate error for polls in both midterm races was around two points and polls in both races underestimated support for the Democratic candidates.[iv] Comparatively speaking, the errors for the 2022 midterms were quite similar to 2016, a year widely considered a polling debacle.
Table 1. Selected Polling Outcomes for the 2022 Pennsylvania Midterm Election and Recent Presidential Elections
|
2022 Midterm Polls |
Correct |
Unsigned |
Signed |
Biased |
Candidate |
|
governor |
100% |
4.79 |
-3.67 |
53% |
-1.83 |
|
senate |
47% |
4.19 |
-4.03 |
53% |
-2.02 |
|
Presidential Polls |
|||||
|
2008 |
100% |
2.62 |
-1.18 |
23% |
-0.59 |
|
2012 |
94% |
2.17 |
-1.18 |
25% |
-0.59 |
|
2016 |
7% |
4.67 |
4.50 |
66% |
2.25 |
|
2020 |
79% |
3.95 |
2.97 |
48% |
1.49 |
|
|
|
|
|
|
|
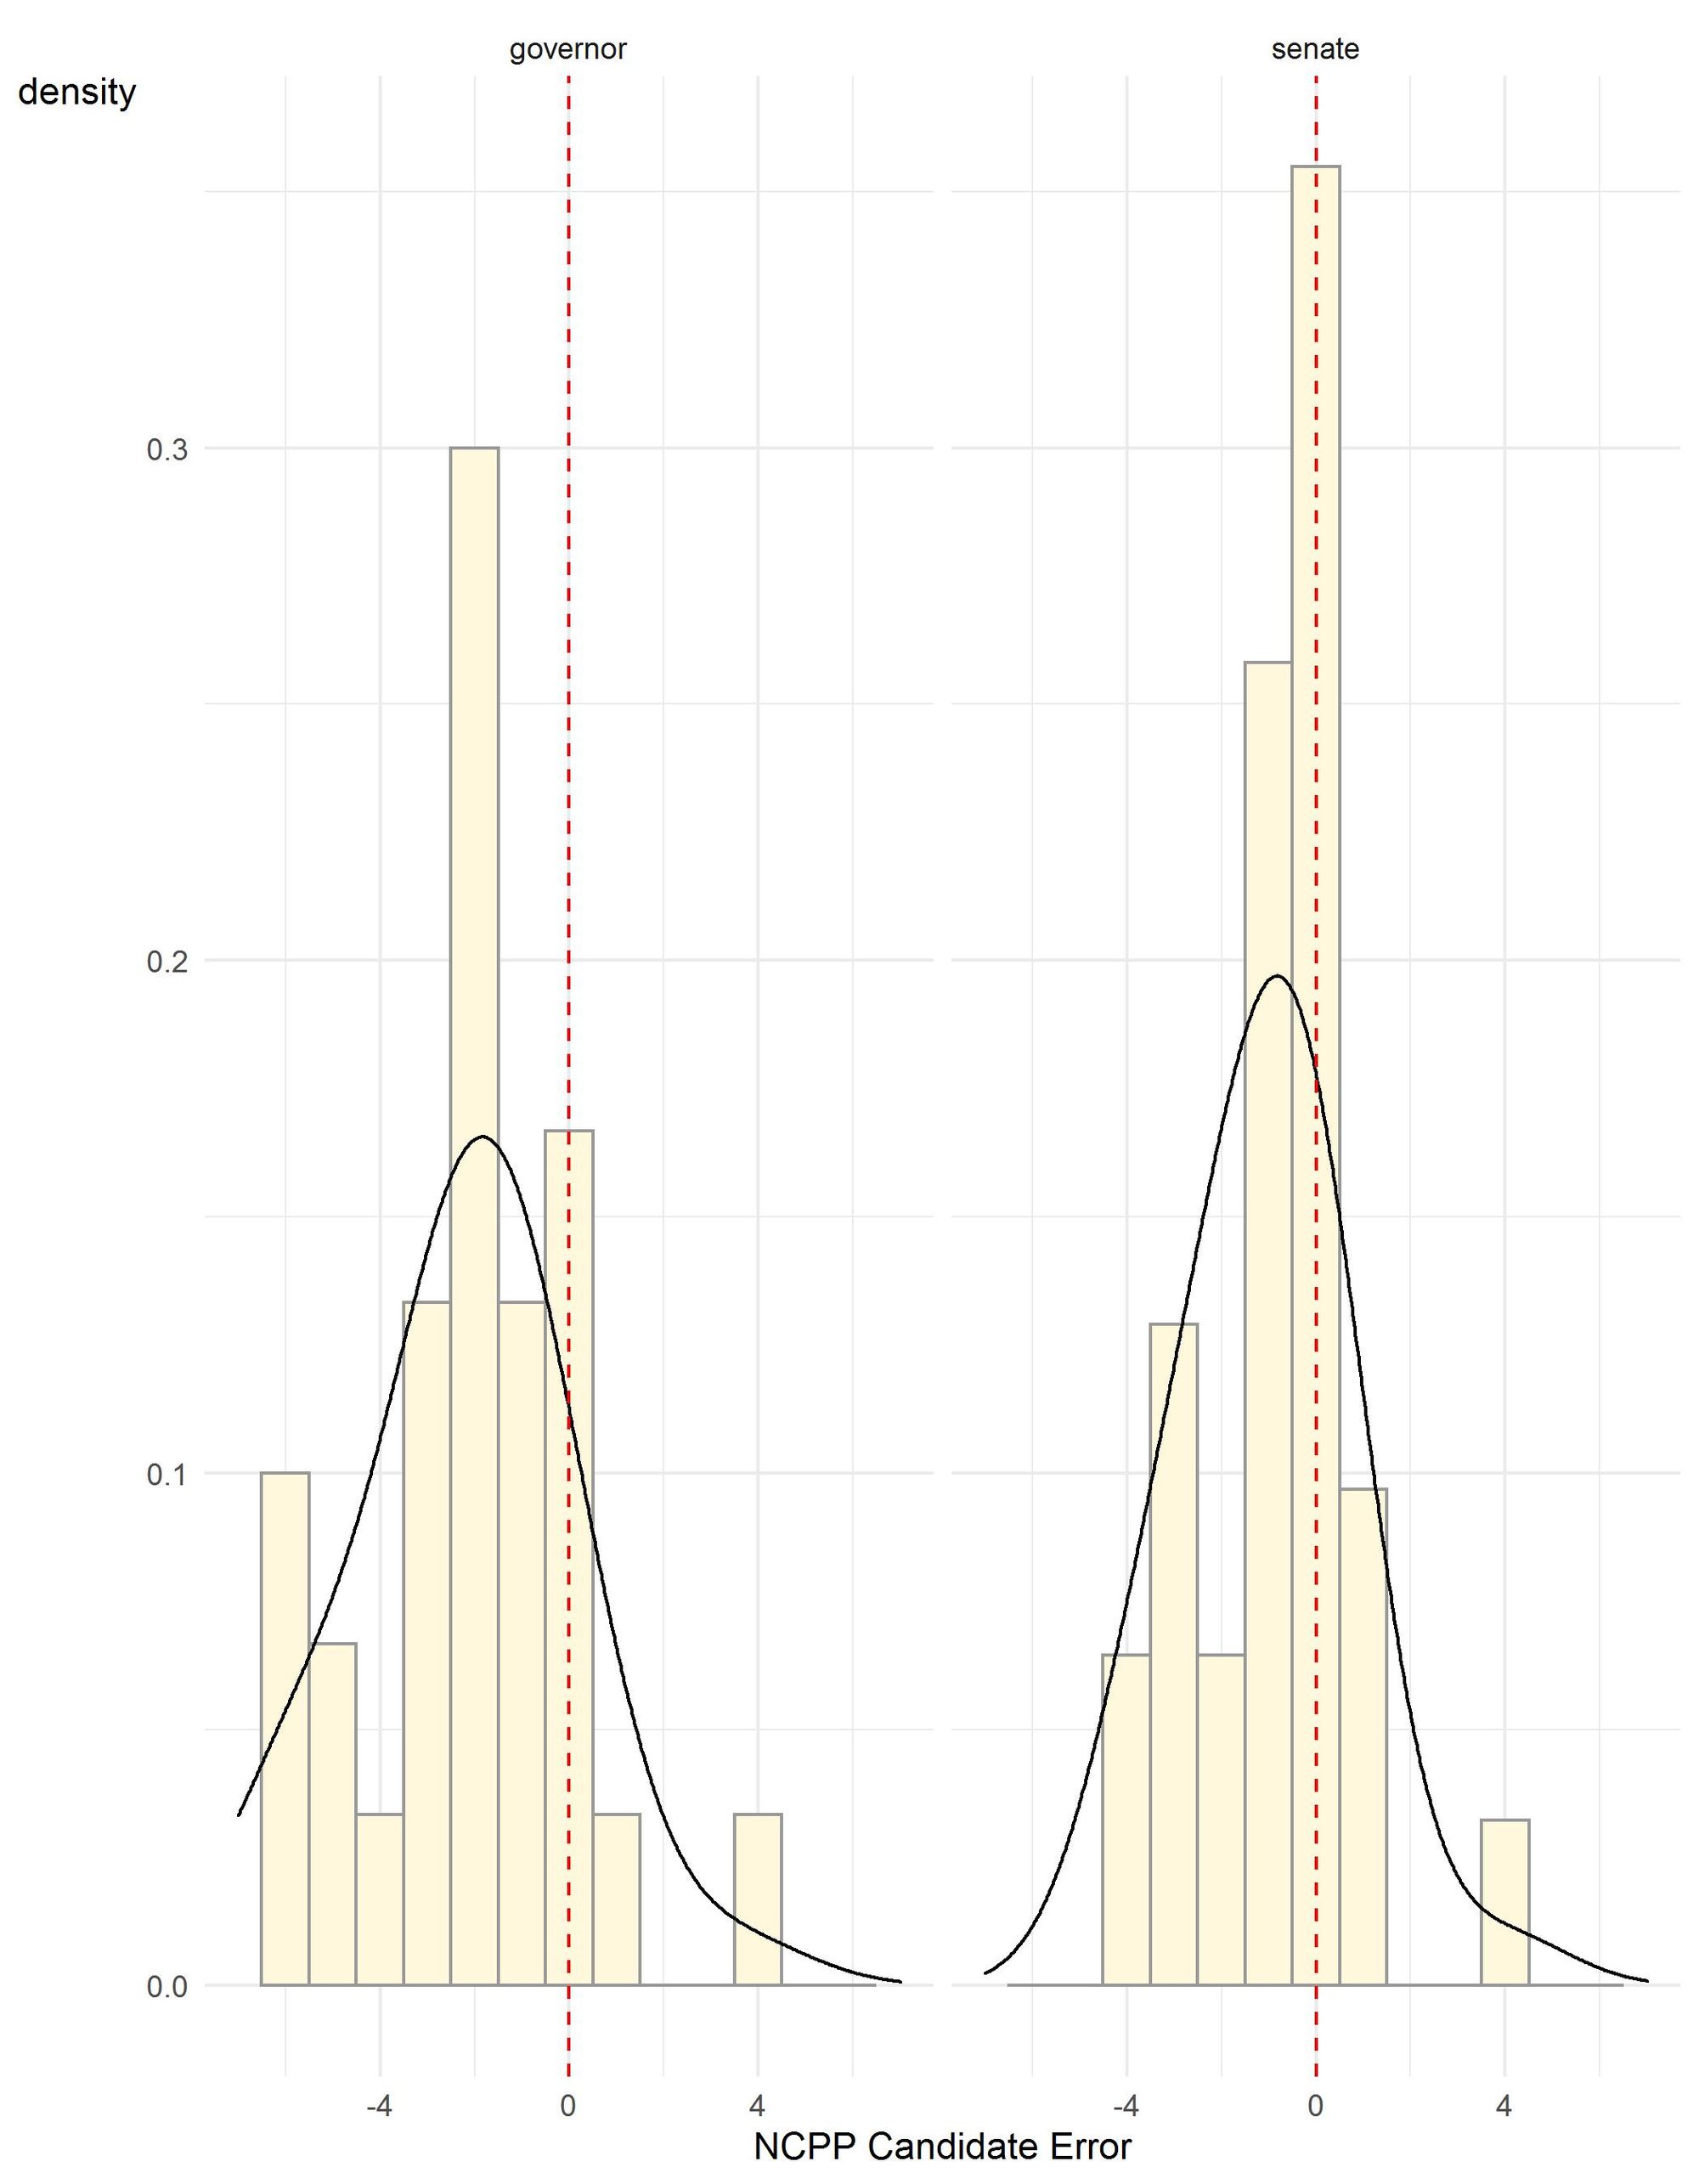
Figure 1 provides a visual display of the polling errors by race and summarizes the main features of the polling error in 2022. Each panel in the figure shows a curve that represents the general shape of the polling errors, peaking to the left of zero in both races, as well as the actual distribution of the poll errors represented by the bars. Many of the Senate polls are centered on zero while the majority of gubernatorial polls have an error around minus two. Figure 1 clearly shows the two main features of the midterm polling errors: 1) both races underestimated support for the Democratic candidates, and 2) the misses for governor were a bit larger than the misses for Senate.

Figure 1. NCPP candidate error for polls conducted in the final three weeks of the 2022 Pennsylvania midterm election
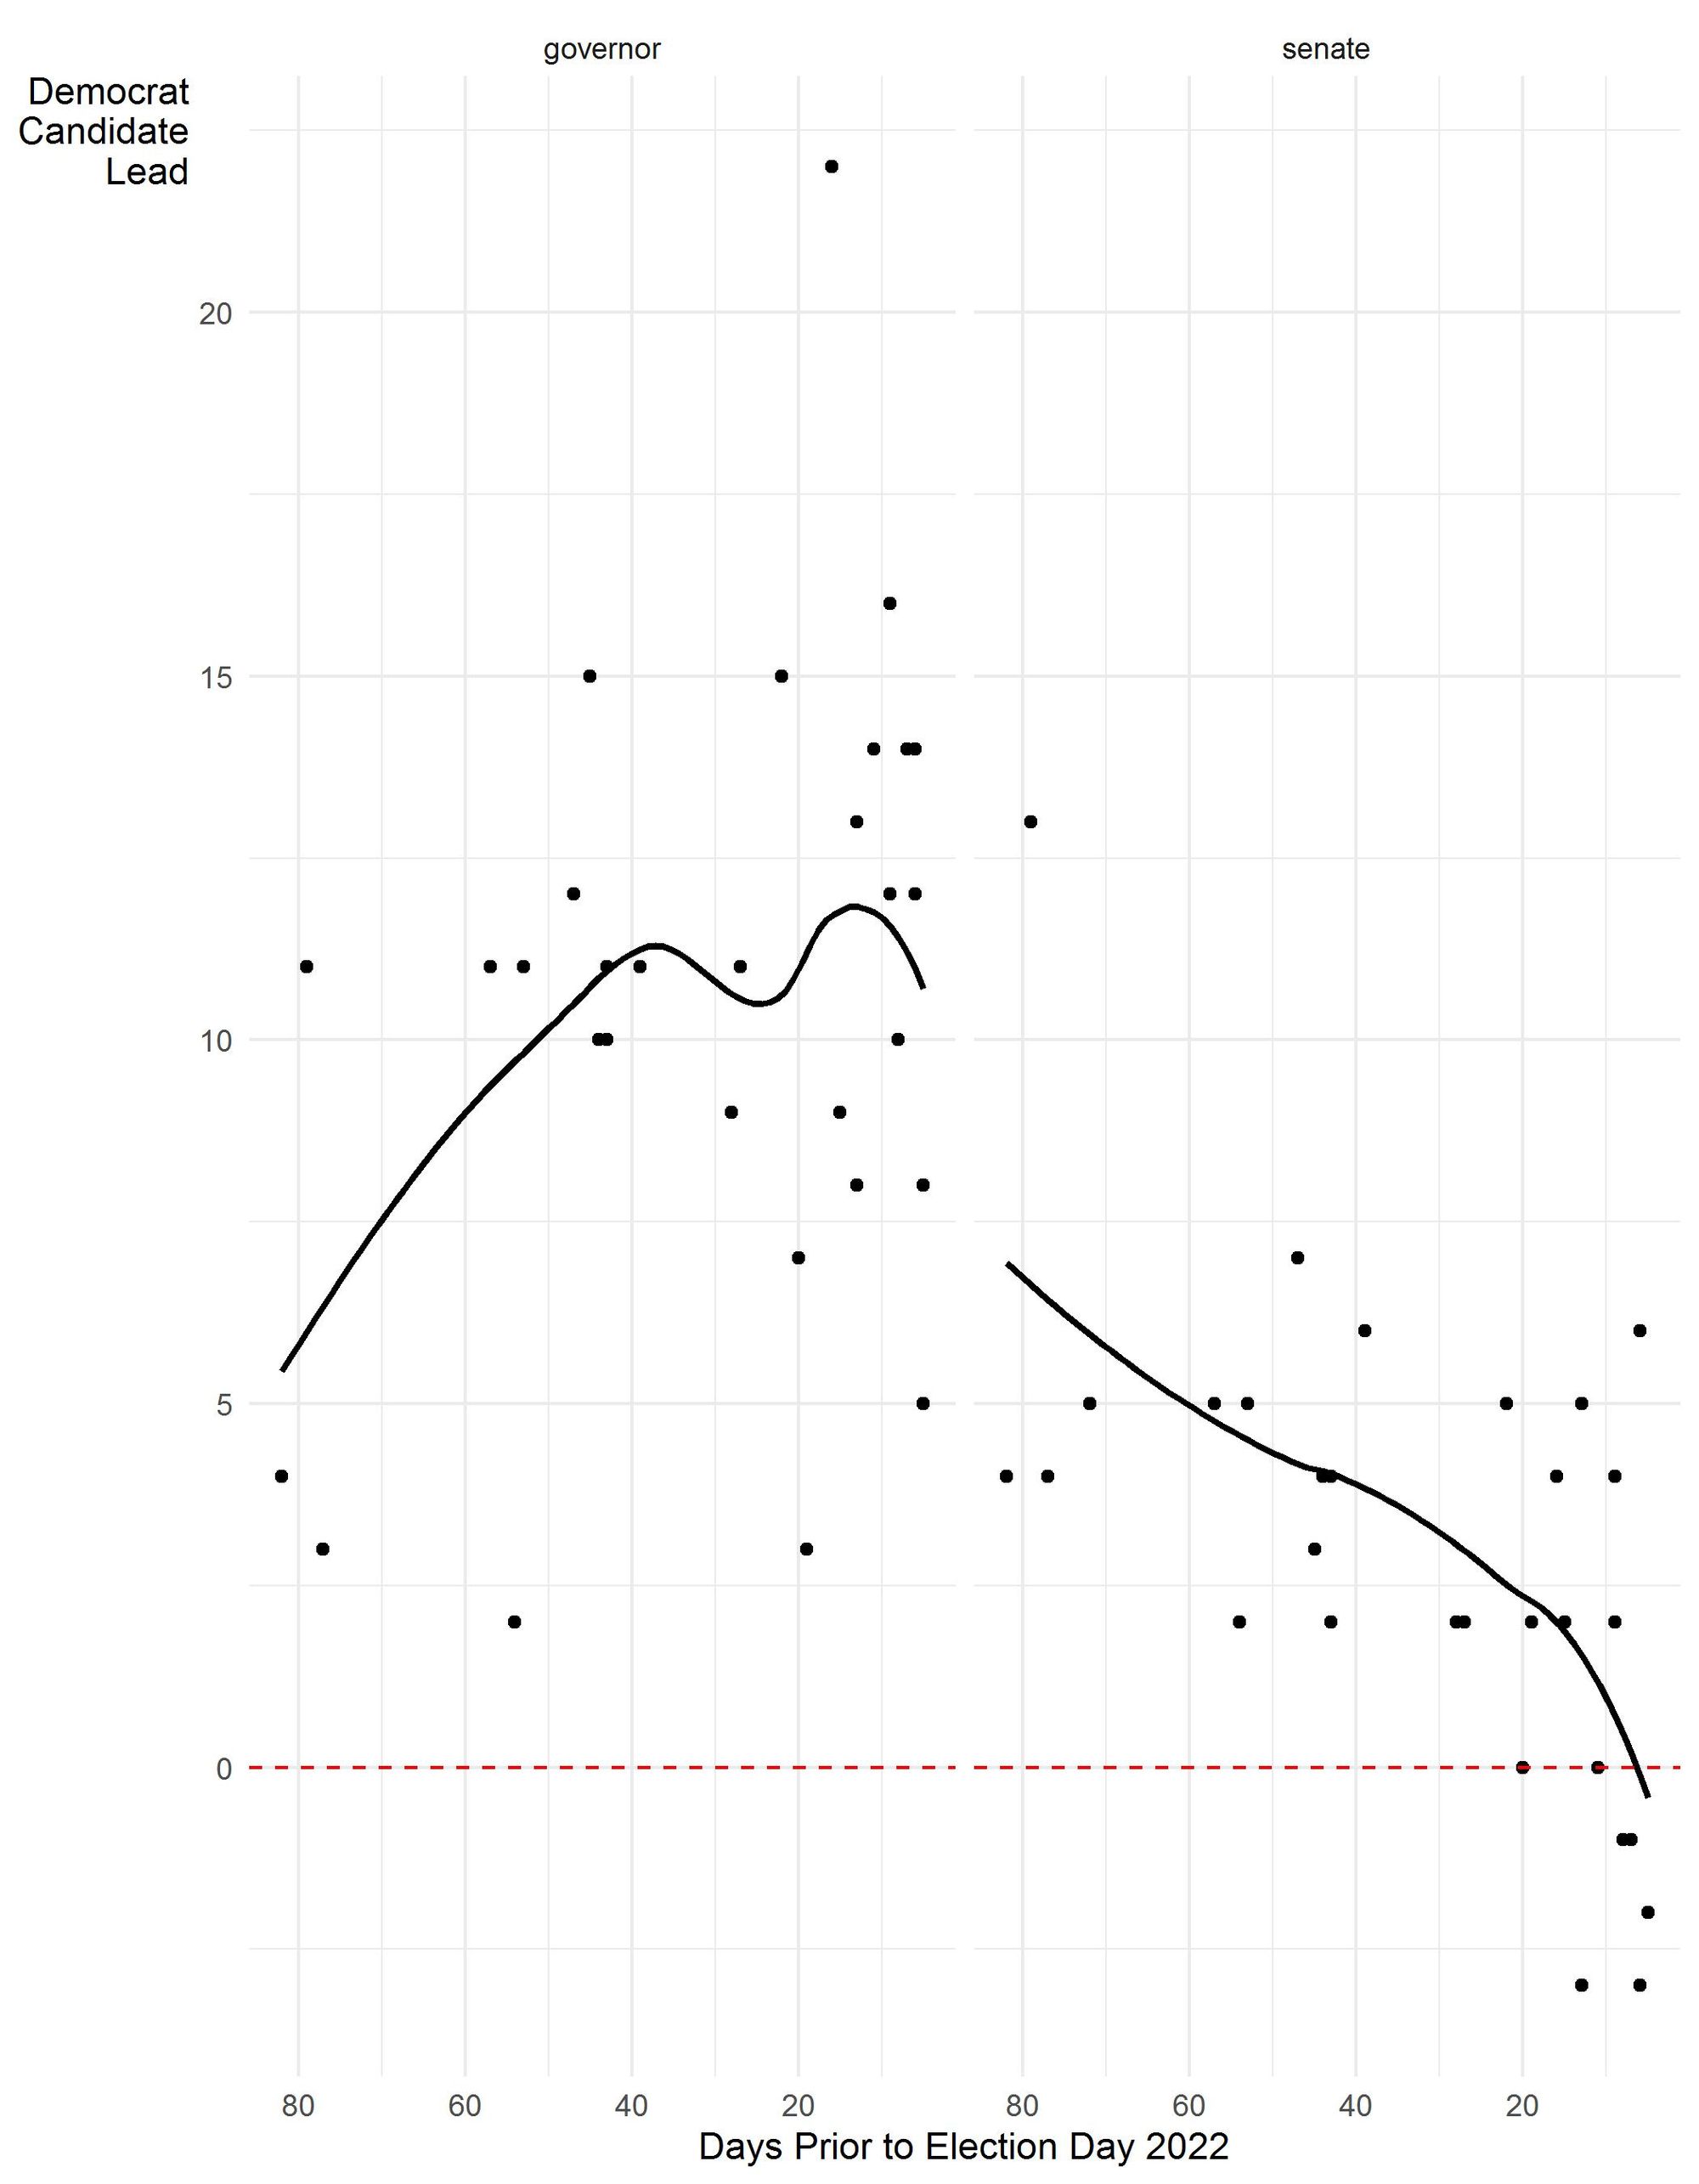
Figure 2 presents a wider perspective on the state’s polling in both races. The trend lines that begin in August were pointed directly at the final outcomes (a 14.8 win by Democrats in the governor’s race and a 4.9 point win in the U.S. Senate race) until about the last week of the campaign, when the trend lines in both races moved substantially toward Republicans. Four of the final five polls released about the Senate race showed Republican Mehmet Oz with a lead while two of the five gubernatorial polls showed only a single-digit advantage for Democrat Josh Shapiro. Not coincidentally, four of these five polls were conducted by pollsters who also do partisan work.

Figure 2. Polling estimates of Democratic candidate preference subtracted from Republican candidate preference by proximity to Election Day, Pennsylvania 2022
This divergence between the election results and the purported movement in the final week’s polling became a topic of post-election conversation, with some criticizing the decisions of poll aggregators to include partisan polls in their polling averages.[v] Undeniably, the partisan polls released at the end of the race produced the bends in the trends that show up in Figure 2 and removing them from an assessment of poll performance makes the polling look much better. Table 2 shows that partisan polls had significantly more error in both races.
|
All Polls |
Correct |
Unsigned |
Signed |
Biased |
Candidate |
|
governor |
1.00 |
4.79 |
-3.67 |
0.53 |
-1.83 |
|
senate |
0.47 |
4.19 |
-4.03 |
0.53 |
-2.02 |
|
Non-partisan |
|||||
|
governor |
1.00 |
4.11 |
-2.24 |
0.44 |
-1.12 |
|
senate |
0.78 |
2.50 |
-2.23 |
0.22 |
-1.12 |
|
Partisan |
|||||
|
governor |
1.00 |
5.80 |
-5.80 |
0.67 |
-2.90 |
|
senate |
0.00 |
6.73 |
-6.73 |
1.00 |
-3.37 |
Transparency and methodological pluralism
Assessing a poll’s quality solely by comparing the outcome of a race to a single number, the horse race, is reductive considering the rich, contextual information a well-designed poll can provide about a race. I’ve written before that we are wiser when we use polling as a map to the political geography than when we use it to predict an outcome. Many pollsters, ourselves included, are trying to understand what is influencing voters and shaping the race, but are not really trying to pick a winner. These pollsters remain faithful to the notion that their poll is merely a snapshot and a description, not a prediction.
Despite my personal distaste for judging a poll on that one number, there is no denying that some people have tremendous interest in horse-race polling. The use of poll aggregation sites like 538 and RealClearPolitics provide information that people want despite the fact that they encourage prediction, not context, and essentially strip polls of any substantive use beyond tracking the horse race. Poll aggregation encourages bad behaviors like herding, treats every poll as methodologically comparable even when they are not, and in fact may encourage publicity seekers or bad actors who try to game them. But, they are too embedded in the pol-journ ecosystem to go away.
Having a broad range of polls with different approaches and underlying assumptions represented in the poll averages, including partisan polls, is probably better than excluding them because no one pollster or methodological technique can really claim their approach is always best. The National Science Foundation (NSF) has acknowledged this truth by funding voter surveys that provide space for learning and collaboration by using a variety of different firms, sampling strategies, and survey methods. But, it is important to know that a main feature of the NSF work is a commitment to transparency, which means that pollsters are providing detailed descriptions of the methods and assumptions used to produce their surveys.
Poll aggregators could require more transparent reporting about polling methods so consumers can understand how to interpret the meaning of the polls they post. But if the aggregators don’t do that work, it will fall on consumers themselves to do it. My advice is that if a poll lacks the basic information necessary to judge its quality, ignore it.
[i] See Clinton, Josh et al (2021). 2020 Pre-Election Polling: An Evaluation of the 2020 General Election Polls for a long-term perspective on polling errors. The report can be found at https://www-archive.aapor.org/Education-Resources/Reports/2020-Pre-Election-Polling-An-Evaluation-of-the-202.aspx.
[ii] There were too few polls conducted during the 2018 midterms for comparison because neither incumbent in those races was expected to have trouble getting reelected. There were only two senate and two gubernatorial polls conducted in the last three weeks of Election Day reported on RealClearPolitics in 2018.
[iii] The measure of predictive accuracy A developed by (Martin, Traugott, and Kennedy 2005) that compares the ratio of preferences for the major party candidates to the ratio of the final vote tally for each is used to measure accuracy and bias. The natural log of this odds ratio (ln odds) is used because of its favorable statistical properties and the ease of calculating confidence intervals for each estimate. The confidence interval for a poll that reasonably predicts the final outcome of the election will overlap zero. The Republican candidates’ poll preferences and vote totals are the numerators in all the calculated ratios, which means a negative value for the ln odds is an overestimate in favor of Democratic candidates and a positive value is an overestimate in favor of Republican candidates. The 2022 polling results used in this analysis were taken from the RealClearPolitics website and included polls released in the three weeks prior to Election Day. The polls for the 2008, 2012, and 2016 elections were downloaded from 538, while the polls for the 2020 election were downloaded from RealClearPolitics. For the calculations prior to 2022 and consistent with the A methodology, the Republican candidate is used in the numerators. In all years, the sample sizes used to estimate variance are probably too large since they tend to include all respondents and not just those who had a preference for the major party candidates and because many pollsters do not adjust for the expected design effects of their weighting schemes.
[iv] Candidate error is a method used by the National Council on Public Polls (NCPP) to determine how closely published polls match the final election returns. The candidate error is one-half the error of the difference between the top two candidates. For example, the Trafalgar Group survey released a few days prior to the election showed that John Fetterman trailed Mehmet Oz 48% to 46%, a two-point gap. Subtracting the estimate (-2) from the actual result (4.9) shows the poll was off by - 6.9 points. Dividing this result by two produced the final candidate error estimate of -3.45 for the survey.
[v] Jim Rutenberg, Ken Bensinger, and Steve Eder. (2022). The ‘Red Wave’ Washout: How Skewed Polls Fed a False Election Narrative. The New York Times, December 31, 2022.
Franklin & Marshall College Poll Newsletter
Join the newsletter to receive the latest updates in your inbox.
