
Franklin & Marshall Poll Release: February 2024
Our new poll shows that the 2024 race between Biden and Trump is still close. Other results include the mood of Pennsylvania voters and their positions on marijuana legalization, gambling, and taxes on electric vehicles.
Dear Readers,
I'm writing to share our summary report for the February 2024 Franklin & Marshall College Poll. I've highlighted a few of the key findings below, but I encourage you to read the full report, which is also included. The Poll explores the mood of the state’s voters, their positions on issues like marijuana legalization and gambling, their ratings of state political figures, as well as their preferences in the presidential and U.S. Senate races.
Thank you for reading,
Berwood Yost
Key Findings
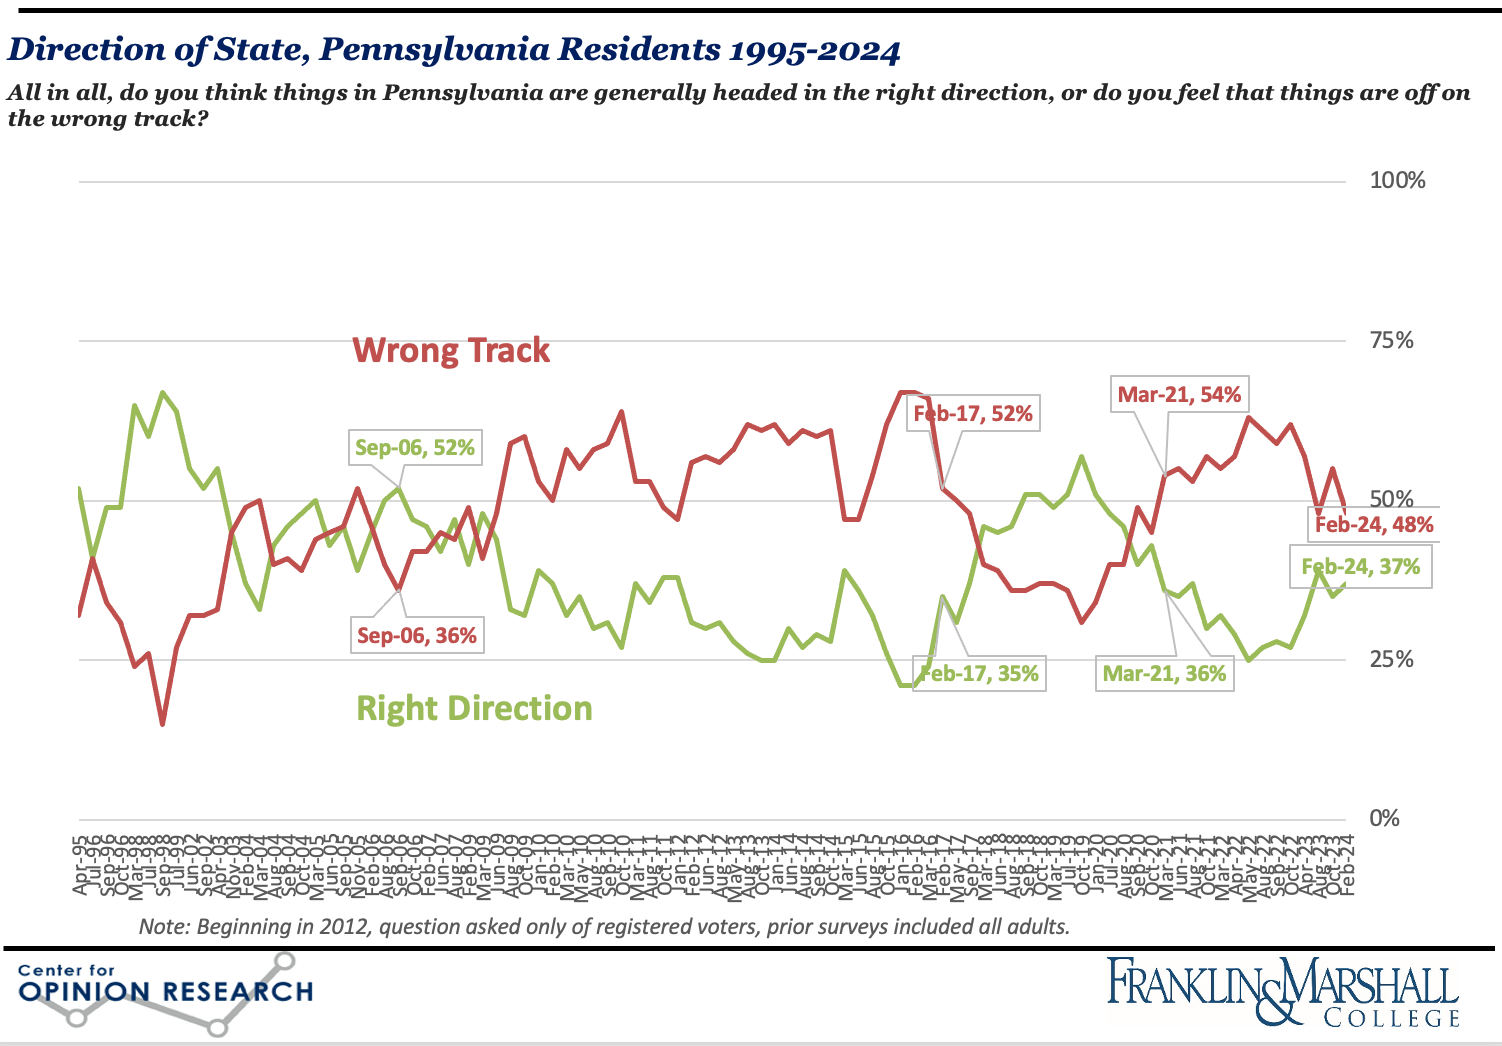
The February 2024 Franklin & Marshall College Poll finds that although the state’s registered voters are generally pessimistic about the economy and the direction of the state, these indicators are starting to move in a more positive direction. Fewer registered voters expect to be “worse off” financially a year from now than believed that in our last survey (24% compared to 35% in October) and fewer say things in the state are “off on the wrong track” (48% compared to 55% in October). Among the nearly half (47%) of respondents who say they are “worse off” financially than a year ago, inflation (38%), the cost of living generally (19%), the cost of food specifically (7%), and stagnant wages (7%) are the main reasons they feel worse off.
The survey also includes notable findings about state-level issues on skill games, fees for electric vehicles, and marijuana legalization:
- Most (60%) voters believe skill games should be regulated and taxed in the same way that casino-based games are regulated and taxed in the state. More respondents opposed (56%) than favored (32%) banning skill games.
- Nearly three in five (59%) respondents favor requiring electric vehicle owners to pay an annual fee to help fund road construction and maintenance.
- Two in three (63%) registered voters believe recreational marijuana should be legalized in the state.
Shapiro Job Approval Rating
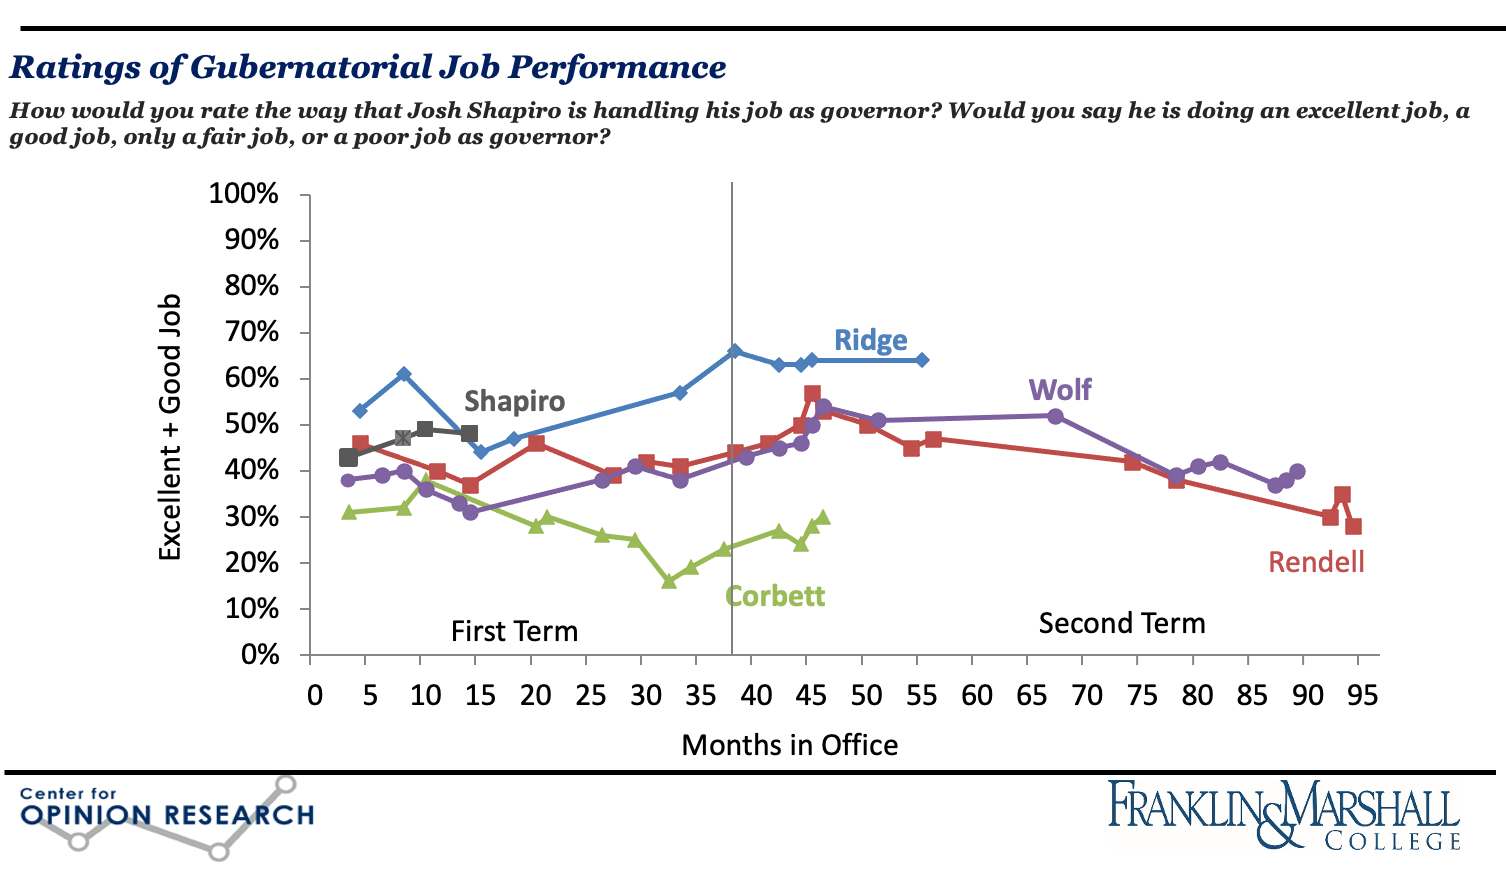
Governor Shapiro’s job approval ratings remain high: almost one in two (48%) registered voters believes he is doing an “excellent” or “good” job as governor. This is the highest approval rating for a governor at this point in a first term since Governor Ridge. Governor Shapiro has more positive ratings among Democrats (75%) and Independents (36%) than either Senator Casey or President Biden. Shapiro is also rated positively by one in five (25%) Republicans.
Biden Job Approval Rating and General Election Match-Ups
About one in three (32%) registered voters in Pennsylvania believes President Biden is doing an “excellent” or “good” job as president, which is consistent with his recent ratings. President Biden’s current rating is lower than President Trump’s and President Obama’s ratings in Pennsylvania at the same point in their terms. A majority of Democrats (64%) rate the president’s performance positively, while fewer Republicans (8%) or Independents (19%) do so. The president’s approval ratings continue to languish within key Democratic constituencies. President Biden is viewed more unfavorably (57%) than favorably (41%) by the state’s voters.
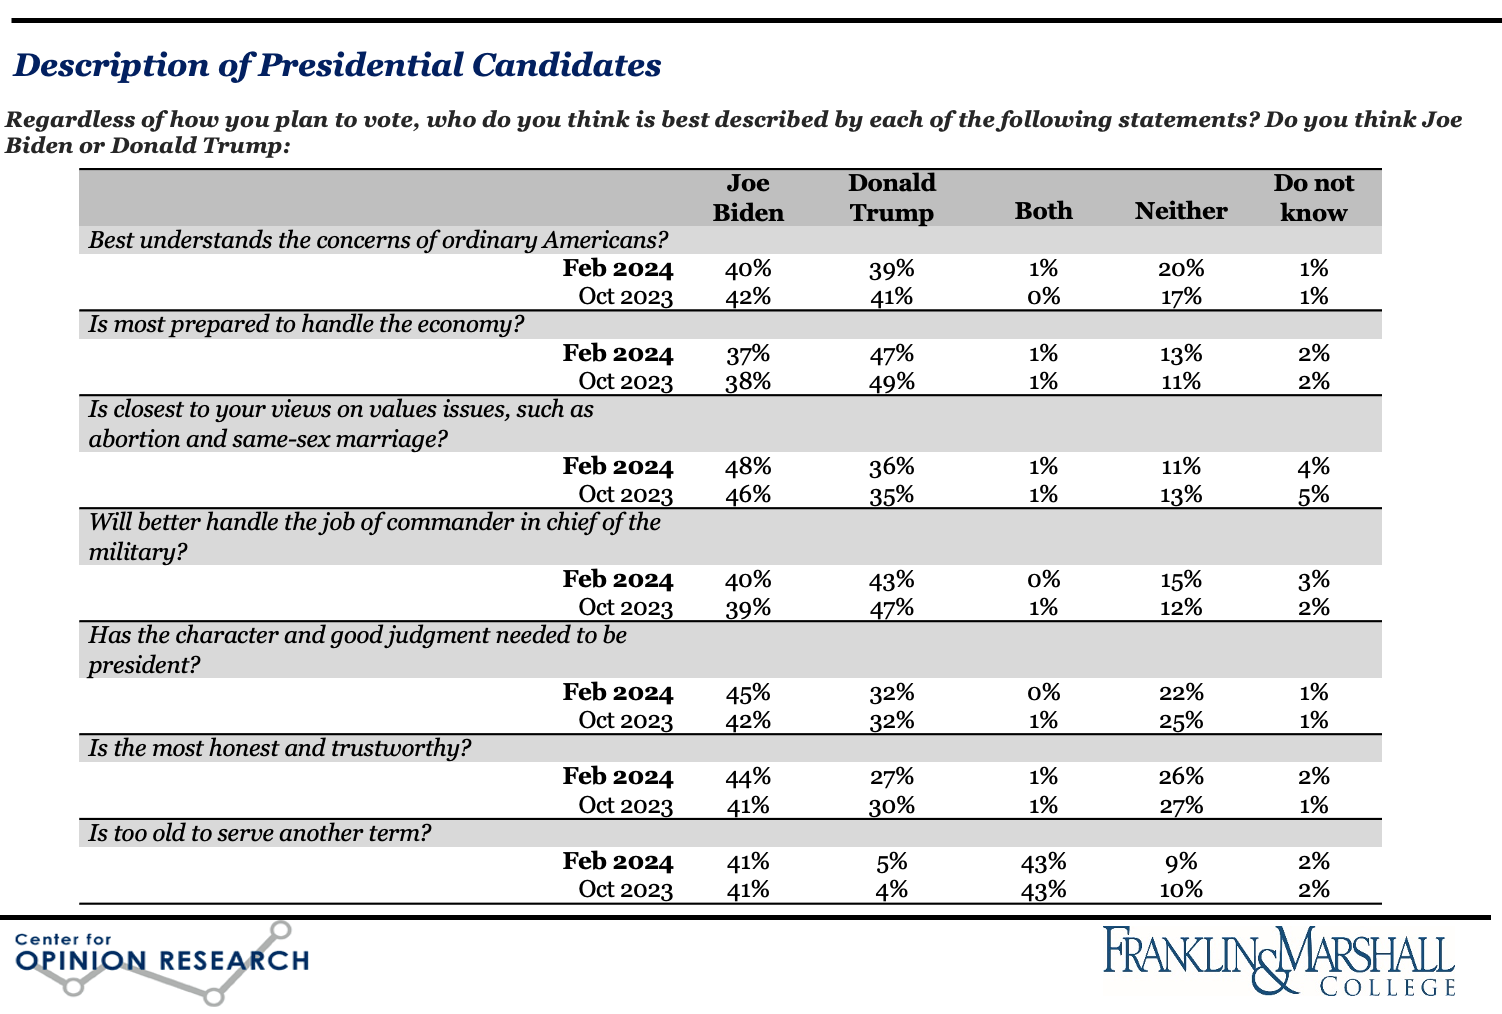
President Biden narrowly leads Donald Trump in Pennsylvania, 43% to 42%, in a one-on-one match up. President Biden’s advantage is larger, 42% to 37%, when third-party candidates are included. More voters believe President Biden has better judgment, is more trustworthy, and is closer to their views on values issues than Mr. Trump, while more voters believe Mr. Trump is better able to handle the economy and serve as commander-in-chief . More than two in five (43%) voters say that “both” President Biden and Mr. Trump are too old to serve another term. Perceptions of the candidates’ relative issue strengths have changed little since October, although President Biden’s advantages on questions of character and honesty have increased. One in five (20%) voters has an “unfavorable” opinion of both presidential candidates.
Casey Job Approval Rating and General Election Match-Up
About one in three (35%) registered voters in Pennsylvania believes Bob Casey is doing an “excellent” or “good” job as their U.S. senator. Senator Casey’s ratings are a bit lower than his ratings in October 2018, prior to his last election, when he had a 43% positive job approval rating, although they are the same as his ratings in January 2012 (35%), about one year prior to his first re-election campaign. One in five (20%) voters say they don’t know enough about the senator to rate his performance. A majority of Democrats (61%) rate Casey’s performance positively, while fewer Republicans (13%) or Independents (25%) do so. Senator Casey is viewed more favorably (39%) than unfavorably (31%) by the state’s registered voters. Senator Casey leads Republican David McCormick 47% to 35% in a head-to-head match up for U.S. Senate, which is about the same advantage he held over McCormick in October (46% to 39%).
Methodology
The survey findings presented in this release are based on the results of interviews conducted January 17 - 28, 2024. The interviews were conducted at the Center for Opinion Research at Franklin & Marshall College. The data included in this release represent the responses of 1,006 registered Pennsylvania voters, including 450 Democrats, 414 Republicans, and 142 Independents.[1] The sample of voters was obtained from Aristotle. All sampled respondents were notified by mail about the survey. Interviews were completed over the phone and online depending on each respondent’s preference. Survey results were weighted (age, gender, education, geography, vote history, and party registration) using an iterative weighting algorithm to reflect the known distribution of those characteristics. Estimates for age, geography, and party registration are based on active voters within the Pennsylvania Department of State’s voter registration data. Gender and education are estimated using data from the November 2022 CPS Voter Registration Supplement.
The sample error for this survey is +/- 3.6 percentage points when the design effects from weighting are considered. The sample error for questions based on subgroups is larger.[2] In addition to sampling error, this poll is also subject to other sources of non-sampling error. Generally speaking, two sources of error concern researchers most. Non-response bias is created when selected participants either choose not to participate in the survey or are unavailable for interviewing. Response errors are the product of the question and answer process. Surveys that rely on self-reported behaviors and attitudes are susceptible to biases related to the way respondents process and respond to survey questions.
[1] The data reported here is voter REGISTRATION and is consistent with past reporting practices. The survey also asked about self-reported voter IDENTIFICATION, which shows a slightly different partisan split: 40% identify as Republican (n=406), 11% as Independent (n=110), and 44% as Democrat (n=445) and the balance not offering a response. Partisan comparisons in this summary show self-reported registration.
[2] The SE for the two-way presidential horse race question (n=507) is +/- 5.0% and the SE for the multi-candidate presidential horse race question (n=499) +/- 5.1%.
Franklin & Marshall College Poll Newsletter
Join the newsletter to receive the latest updates in your inbox.